How to read cryptocurrency charts.
If you want to get into cryptocurrency trading, you need to be able to read charts. Charts are an essential tool for technical analysis and can help you make better trading decisions. In this article, we'll show you how to read cryptocurrency charts. We'll cover the different types of charts, what they mean, and how you can use them to your advantage.
How to Read Crypto Currency Charts: The Basics
Cryptocurrency charts are a great way to get an overview of the current market conditions for a particular digital currency. By examining the prices and volumes of a currency over time, you can get an idea of where it is currently trading and what potential risks or opportunities exist.
To read a cryptocurrency chart, you first need to identify the currency you're interested in. Next, you'll need to find the right charting platform. There are a number of different platforms available, so it's important to find one that is suited to your needs.
Once you have your platform set up, you'll need to find the currency you're interested in. To do this, you can use a search engine or browsing the various charts offered by the platform. Once you've found the currency you're looking for, you can start examining the charts.
The first step in decoding a cryptocurrency chart is understanding the different types of data that are displayed. Each type of data has its own meaning and can provide you with different insights into the market.
The most common type of data displayed on cryptocurrency charts is price data. This data shows you the price of a currency at any given point in time, as well as the percentage change from the previous point in time.
Volume data is also commonly displayed on cryptocurrency charts. This data shows you the volume of a currency at any given point in time, as well as the percentage change from the previous point in time. Volume data is important because it can help you understand how active the market is. If there is a large volume of a particular currency being traded, it usually indicates that there are lots of opportunities available. Conversely, if there is little volume of a particular currency being traded, it usually indicates that there are few opportunities available.
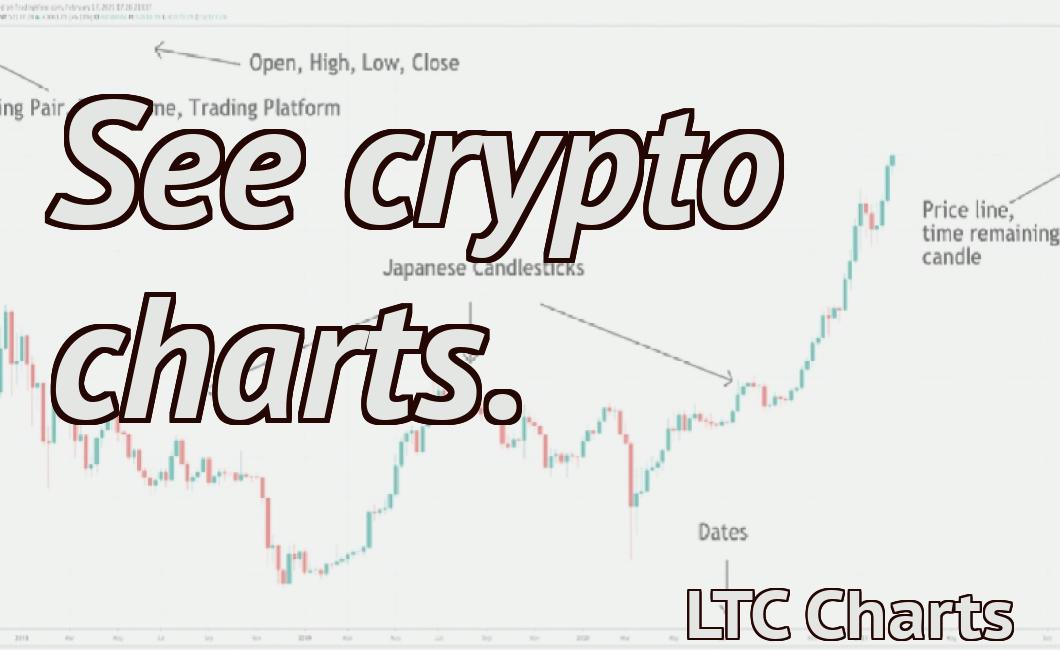
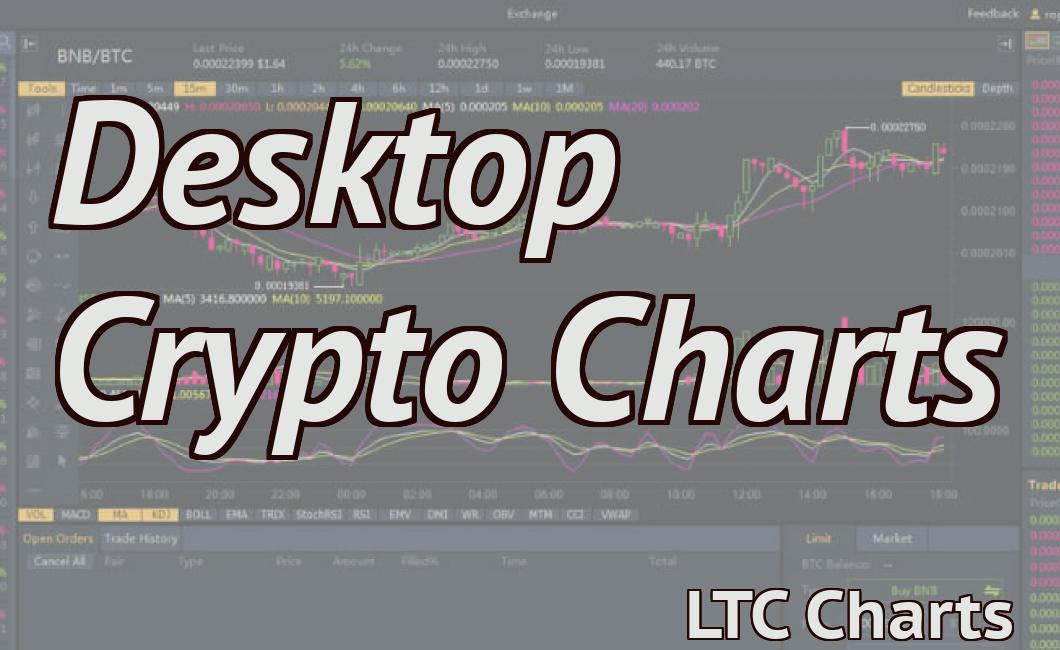
Another type of data that is often displayed on cryptocurrency charts is technical indicators. Technical indicators are mathematical formulas that are used to predict future trends in the market. Some of the most common technical indicators used in cryptocurrency trading are Moving Averages (MA), Relative Strength Index (RSI), and Candlesticks.
Once you have a basic understanding of the different types of data that are displayed on cryptocurrency charts, it's easy to start decoding them. The most important thing to remember is to always stay aware of your own risk profile when trading cryptocurrencies.
How to Read Crypto Currency Charts for Beginners
Cryptocurrency charts are a great way to get started learning about crypto currencies. The best way to understand how to read cryptocurrency charts is by starting with the basics.
When you are looking at a cryptocurrency chart, the first thing you want to do is identify the main indicators. These indicators will give you an idea of how the coin is performing.
The most important indicator is the price chart. This chart will show you the prices of the coin over time. The second most important indicator is the volume chart. This chart will show you how many coins have been traded over the course of the day.
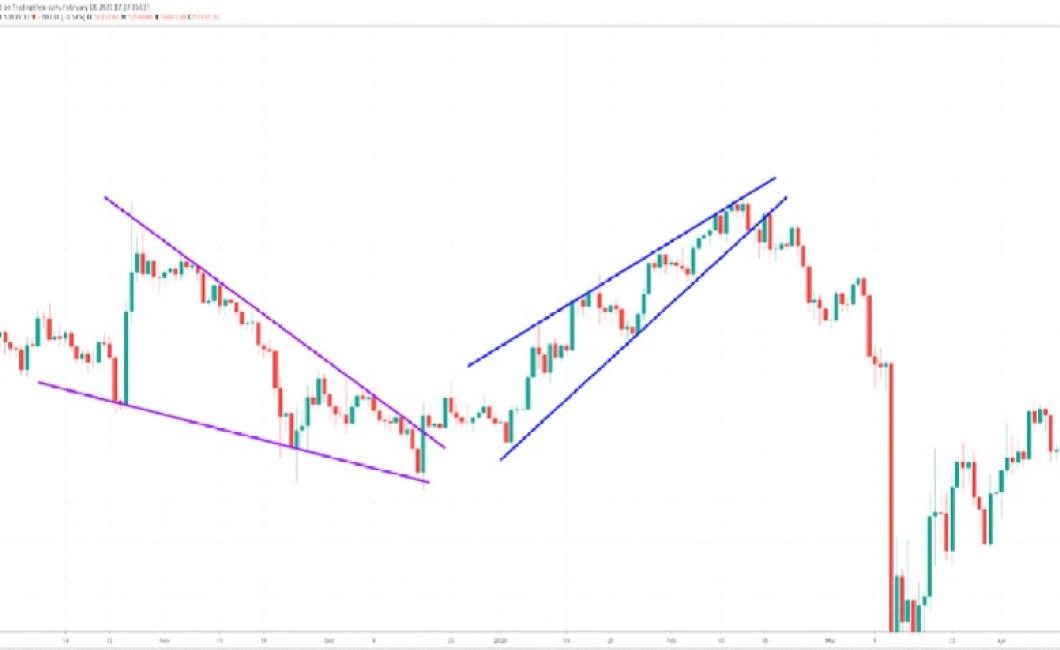
After you have identified the main indicators, you can start to look for patterns. Patterns can indicate whether a coin is going up or down, and they can help you predict future trends.
Finally, you want to think about how to invest in cryptocurrencies. Cryptocurrencies are volatile, and it can be difficult to predict how they are going to perform in the future. That’s why it’s important to do your research before investing.
How to Read Crypto Currency Charts: A Step-By-Step Guide
Step 1: Identify the currency you are interested in
The first step is to identify the currency you are interested in. This can be done by looking at the name of the currency or the symbol.
Step 2: Scan the chart for general trends
The next step is to scan the chart for general trends. This will help you to understand how the currency is performing overall.
Step 3: Look for specific information
If you want to learn more about a specific currency, then you need to look for specific information. This can be done by looking at the prices, volume, and other indicators.
How to Read Crypto Currency Charts Like a Pro
Cryptocurrency charts are an essential tool for anyone interested in trading cryptocurrencies. By understanding how to read cryptocurrency charts, you can make informed decisions about whether or not to buy or sell a cryptocurrency.
Cryptocurrency charts are made up of a series of lines that show the price of a cryptocurrency over time. The lines on a cryptocurrency chart are usually plotted in reverse chronological order, which means that the most recent data is on the bottom of the chart.
Cryptocurrency prices are plotted on a grid, with each column representing a different currency. The width of each column represents the percentage of change in the value of that currency over the period shown. For example, if the column in the cryptocurrency chart is wide, that means the currency's value increased by a large percentage over the period shown. If the column is narrow, that means the currency's value decreased by a large percentage over the period shown.
To make buying and selling decisions, it's important to understand how to read cryptocurrency charts. The following tips will help you understand how to read cryptocurrency charts:
1. Look for Trends
One of the most important things to look for when reading cryptocurrency charts is trends. Trends can be identified by looking for patterns in the data. For example, if you see a pattern where the value of a cryptocurrency increases steadily over time, that may be a sign that the cryptocurrency is about to go up in price.
2. Check the Volume
Another important thing to look for when reading cryptocurrency charts is the volume. Volume is a measure of how active the market is. High volume indicates that there is a lot of interest in the cryptocurrency, while low volume indicates that there is less interest in the cryptocurrency.
3. Look at the MACD and RSI
The MACD and RSI are two indicators that can help you make buying and selling decisions. The MACD is a trend indicator that shows how much the value of a cryptocurrency has changed over time, while the RSI is an indicator of how much volatility there is in the price of a cryptocurrency. When the RSI is high, that means there is a lot of price movement and volatility, while when the RSI is low, that means the price is calm and stable.
4. Use Technical Analysis
Technical analysis is a type of analysis that uses charts and indicators to make buying and selling decisions. Technical analysis is often used by day traders, who aim to make quick decisions about whether or not to buy or sell a cryptocurrency. Technical analysis can be used to identify trends, predict future price movements, and determine when it is safe to buy or sell a cryptocurrency.
How to Read Crypto Currency Charts: An Expert's Guide
Cryptocurrency is a digital or virtual currency that uses cryptography to secure the transactions and to control the creation of new units. Cryptocurrencies are decentralized, meaning they are not subject to government or financial institution control. Bitcoin, the first and most popular cryptocurrency, was created in 2009.
How to Read Crypto Currency Charts: The Ultimate Guide
Cryptocurrency charts are one of the most popular tools for traders and investors. They can provide insights into the price and activity of a particular cryptocurrency.
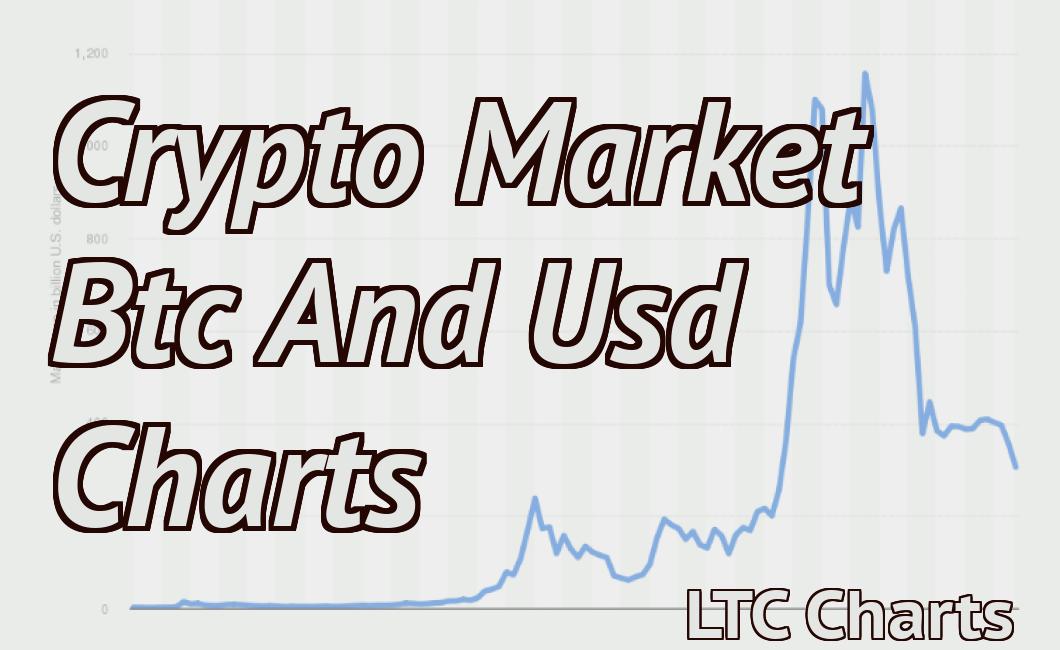
To read cryptocurrency charts, you need to understand three basic concepts: prices, volumes, and market capitalization.
1. Prices
The first thing to understand is the prices of cryptocurrencies. This is where you find out how much a particular cryptocurrency is worth on a given day.
To get the latest prices, you can use online cryptocurrency exchanges or cryptocurrency tracking services.
2. Volumes
The second thing to understand is the volumes of cryptocurrencies. This tells you how many coins are being traded on a given day.
To get the latest volumes, you can use online cryptocurrency exchanges or cryptocurrency tracking services.
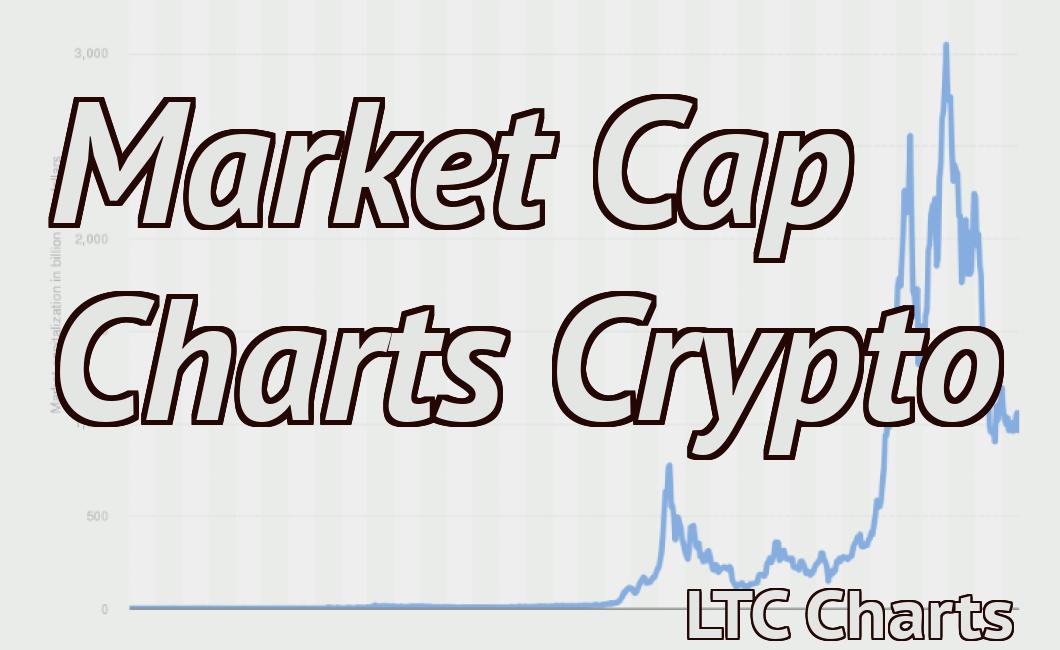
3. Market capitalization
The third thing to understand is the market capitalization of cryptocurrencies. This is a measure of how much money a cryptocurrency has worth.
To get the latest market capitalization, you can use online cryptocurrency exchanges or cryptocurrency tracking services.
How to Read Crypto Currency Charts: The Definitive Guide
Cryptocurrency charts are often one of the more confusing aspects of investing in digital currencies. In this guide, we will walk you through the basics of how to read cryptocurrency charts and help you make informed investment decisions.
What is a Cryptocurrency Chart?
A cryptocurrency chart is a graphical representation of a cryptocurrency's price over time. Cryptocurrencies are often traded on various exchanges and can be quite volatile, so cryptocurrency charts are often used by traders to monitor prices and make informed investment decisions.
Cryptocurrency charts can be divided into two main categories: technical analysis and fundamental analysis. Technical analysis looks at the graphs and patterns to determine whether a cryptocurrency is oversold or overbought, and whether it is about to break out to the upside or downside. Fundamental analysis looks at a cryptocurrency's fundamentals, such as its market cap, circulating supply, and average transaction volume.
How to Read Cryptocurrency Charts
When looking at a cryptocurrency chart, the first thing to do is to identify the cryptocurrency's price trend. This can be done by reading the red and green lines on the graph, which represent the highs and lows of the price over time. Once you have identified the trend, you can start to look for signs that the trend is about to change. Some common signs that a trend is about to change include a sudden jump in the price or a drop in the price followed by a rapid increase.
Once you have identified the trend, you can start to look for signs that the trend is about to change.
Some common signs that a trend is about to change include a sudden jump in the price or a drop in the price followed by a rapid increase. Once you have identified the trend, you can start to look for signals that the trend is about to change. Some common signals that a trend is about to change include a sudden jump in the price or a drop in the price followed by a rapid increase.
Once you have identified the trend, you can start to look for signals that the trend is about to change. Some common signals that a trend is about to change include a sudden jump in the price or a drop in the price followed by a rapid increase.
Once you have identified the trend, you can start to look for support and resistance levels. Support levels are areas where the price has been stable for a while, while resistance levels are areas where the price has been unstable and has previously failed to break through. When looking for support or resistance levels, it is important to pay attention to the height of the bars on the graph and how close they are to each other. If the bars are close together, this indicates that the price is close to breaking through resistance and heading towards the next stage of the trend. If the bars are far apart, this indicates that the price is likely to stay below resistance and may not be ready to break out of the trend.
When looking for support or resistance levels, it is important to pay attention to the height of the bars on the graph and how close they are to each other.
If the bars are close together, this indicates that the price is close to breaking through resistance and heading towards the next stage of the trend. If the bars are far apart, this indicates that the price is likely to stay below resistance and may not be ready to break out of the trend.
Finally, you can use volume indicators to find out how active the market is. Volume indicators measure how much currency is being exchanged hands on a daily basis and can be used to determine whether the market is stable or volatile. The three most common volume indicators are the candle chart, the Relative Strength Index (RSI), and the MACD.
Candle Chart: The candle chart shows how much money has been exchanged over a specific period of time (usually 24 hours). The height of the candle corresponds to the number of transactions that took place during that time period.
The candle chart shows how much money has been exchanged over a specific period of time (usually 24 hours). The height of the candle corresponds to the number of transactions that took place during that time period. Relative Strength Index (RSI): The RSI measures how much volatility there is in a cryptocurrency's price over a given period of time. When the RSI is below 50%, this indicates that the market is relatively calm and stable, while an RSI above 70% indicates that there is more volatility present and that the market may be about to change direction.
The RSI measures how much volatility there is in a cryptocurrency's price over a given period of time. When the RSI is below 50%, this indicates that the market is relatively calm and stable, while an RSI above 70% indicates that there is more volatility present and that the market may be about to change direction. MACD: The MACD shows how much momentum there is in a cryptocurrency's price over a given period of time. When the MACD lines are positive (above 0), this indicates that the price is rising, while when they are negative (below 0), this indicates that the price is falling.
Once you have identified the trend, you can start to look for signals that the trend is about to change. Some common signals that a trend is about to change include a sudden jump in the price or a drop in the price followed by a rapid increase.
Finally, you can use volume indicators to find out how active the market is. Volume indicators measure how much currency is being exchanged hands on a daily basis and can be used to determine whether the market is stable or volatile. The three most common volume indicators are the candle chart, the Relative Strength Index (RSI), and the MACD.
Candle Chart: The candle chart shows how much money has been exchanged over a specific period of time (usually 24 hours). The height of the candle corresponds to the number of transactions that took place during that time period.
The candle chart shows how much money has been exchanged over a specific period of time (usually 24 hours). The height of the candle corresponds to the number of transactions that took place during that time period. Relative Strength Index (RSI): The RSI measures how much volatility there is in a cryptocurrency's price over a given period of time. When the RSI is below 50%, this indicates that the market is relatively calm
How to Read Crypto Currency Charts: The Comprehensive Guide
When you’re considering whether or not to invest in a new cryptocurrency, it can be helpful to understand how these digital tokens are valued. To do this, you need to understand crypto currency charts.
Cryptocurrency charts show the price of a cryptocurrency over time. They are used to determine whether a cryptocurrency is overvalued or undervalued.
There are a few different types of crypto currency charts.
candle chart
A candle chart is a simple way to visualize the price of a cryptocurrency over time. It is made up of two columns: the left column shows the value of the cryptocurrency over time, and the right column shows the number of candles that have been set. A candle is a small, round marker that is used to show the price of a cryptocurrency.
A candle chart is a simple way to visualize the price of a cryptocurrency over time. It is made up of two columns: the left column shows the value of the cryptocurrency over time, and the right column shows the number of candles that have been set. A candle is a small, round marker that is used to show the price of a cryptocurrency. chart pattern
Chart patterns are indicators that can help you predict the future price of a cryptocurrency. They are created by observing the behavior of a particular chart pattern over time.
Chart patterns are indicators that can help you predict the future price of a cryptocurrency. They are created by observing the behavior of a particular chart pattern over time. bar chart
A bar chart is similar to a candle chart, but it shows the value of a cryptocurrency over time in bars. A bar is made up of two columns: the left column shows the value of the cryptocurrency over time, and the right column shows the number of bars that have been set.
A bar chart is similar to a candle chart, but it shows the value of a cryptocurrency over time in bars. A bar is made up of two columns: the left column shows the value of the cryptocurrency over time, and the right column shows the number of bars that have been set. candlestick chart
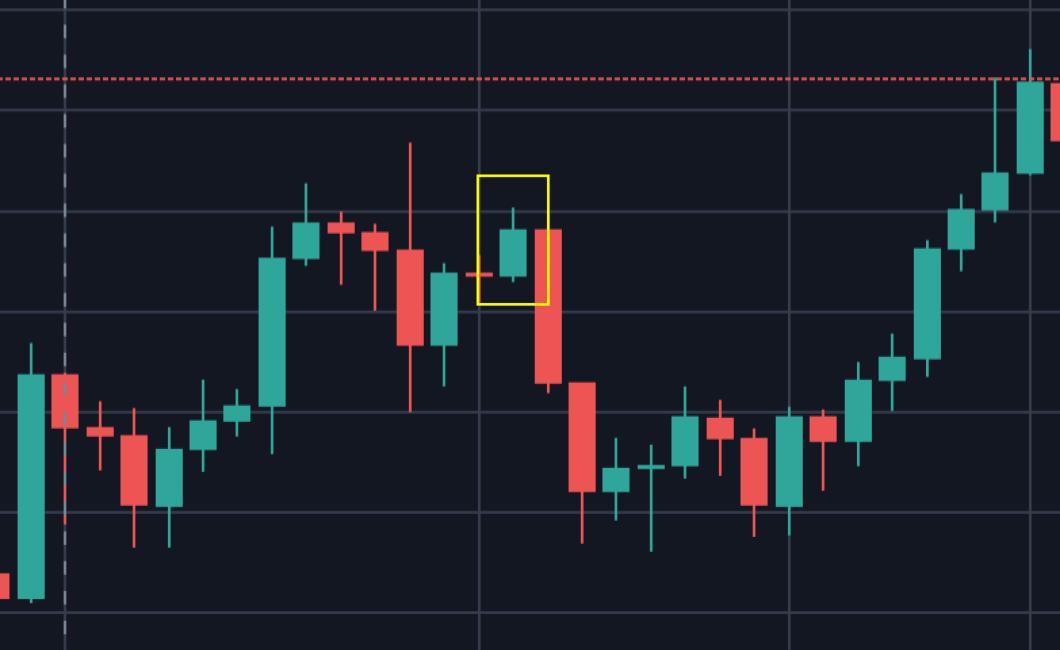
A candlestick chart is similar to a bar chart, but it shows the value of a cryptocurrency over time in candlesticks. A candlestick is made up of two columns: the left column shows the value of the cryptocurrency over time, and the right column shows the number of candles that have been set.
A candlestick chart is similar to a bar chart, but it shows the value of a cryptocurrency over time in candlesticks. A candlestick is made up of two columns: the left column shows the value of the cryptocurrency over time, and the right column shows the number of candles that have been set. OHLC (over-the-counter) chart
An OHLC (over-the-counter) chart is a type of chart that is used to track the price of a cryptocurrency over time. It is similar to a bar chart, but it displays the value of a cryptocurrency in real time.
An OHLC (over-the-counter) chart is a type of chart that is used to track the price of a cryptocurrency over time. It is similar to a bar chart, but it displays the value of a cryptocurrency in real time. volume
Volume is another important factor to consider when analyzing crypto currency charts. Volume measures how many transactions have been made in relation to the total supply of a cryptocurrency. high volume coins
A high volume coin is a coin that has been traded frequently on various exchanges. This means that it has a high level of liquidity and is considered to be more valuable. low volume coins
A low volume coin is a coin that has been traded infrequently on various exchanges. This means that it has a low level of liquidity and is considered to be less valuable.