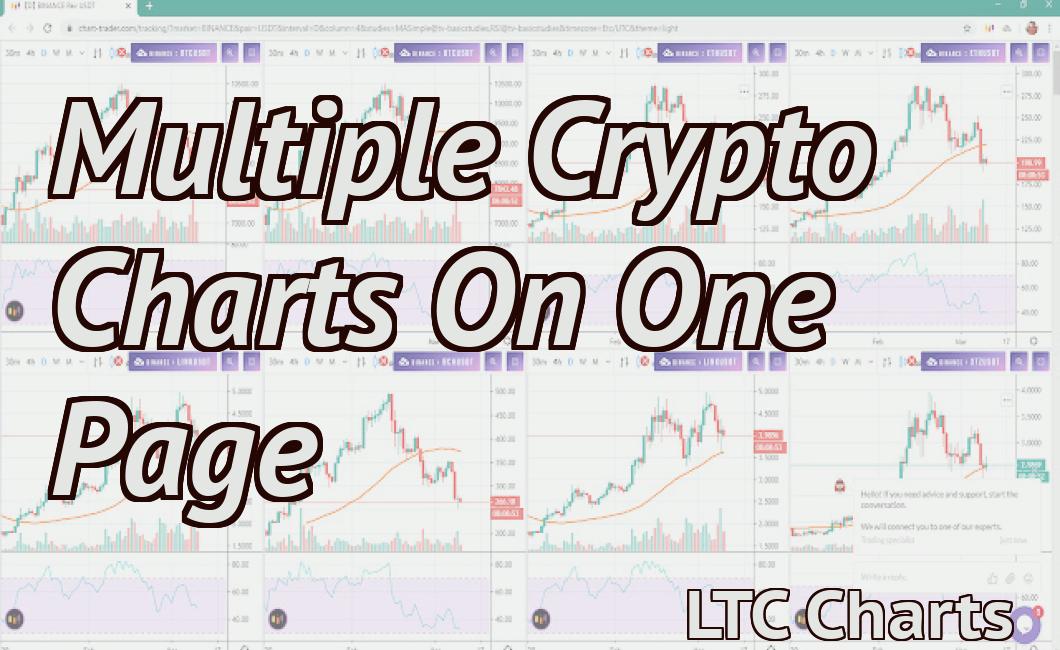
How to read depth charts for crypto.
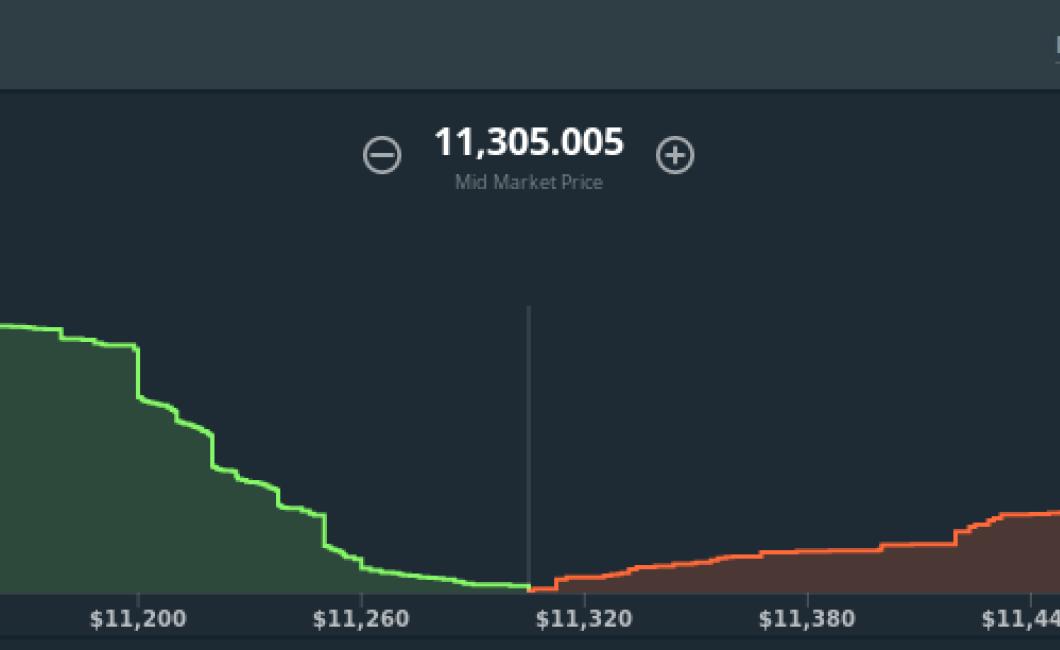
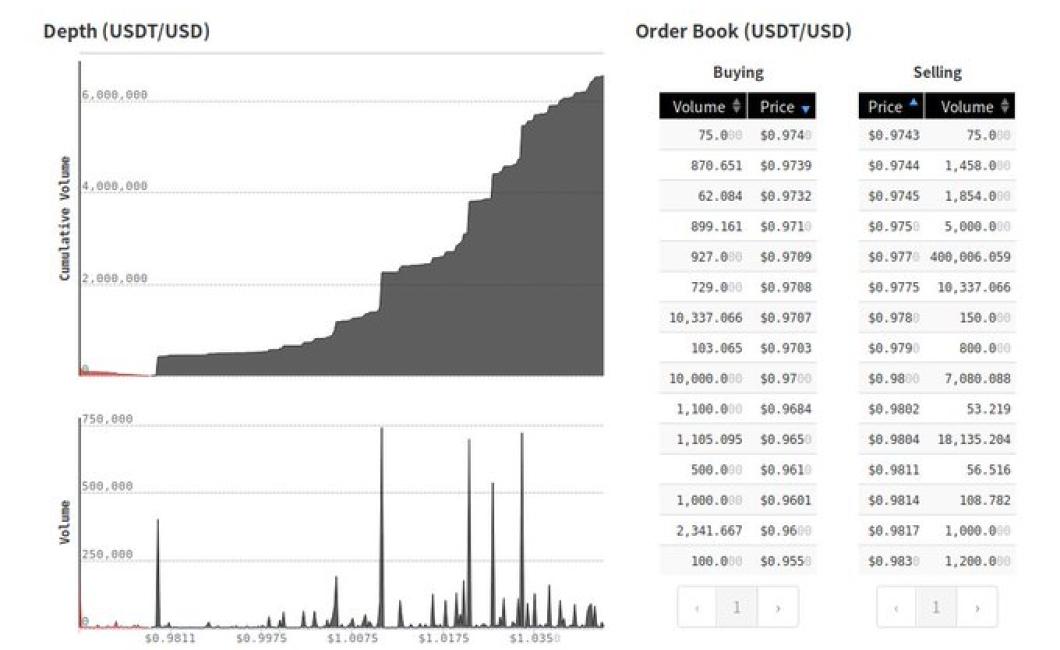
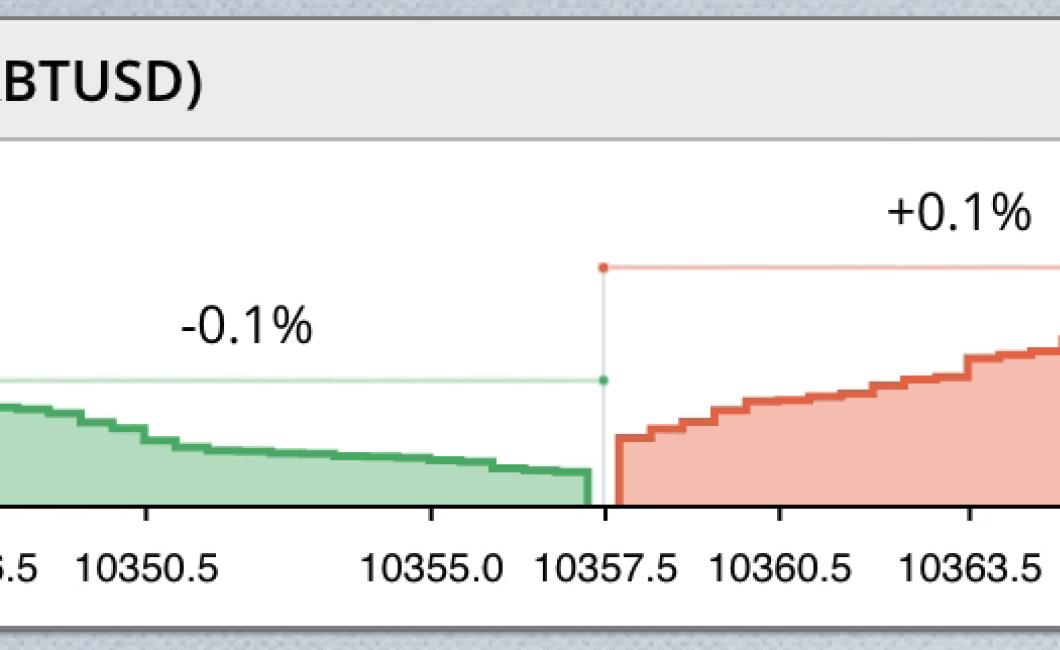
Crypto depth charts can be a little daunting to read at first, but with a little practice they can be extremely helpful in spotting potential trades. The first thing to note is that the horizontal axis represents the price of the asset, and the vertical axis represents the quantity of the asset. The bid price is represented by the green line and the ask price is represented by the red line. The difference between the two is called the spread. The next thing to look at is the order book. This is a list of all the buy and sell orders that have been placed for an asset. The orders are grouped together based on price, with the lowest priced orders at the top and the highest priced orders at the bottom. The order book can give you an idea of where the market is heading, as well as how much liquidity there is at different prices. Finally, you'll also want to pay attention to the order flow. This is a list of all the buy and sell orders that have been executed in the market. The order flow can give you an idea of how aggressive buyers and sellers are, as well as where there might be some imbalances in the market.
How to Read Depth Charts for Crypto Trading
The first step in understanding how to read a depth chart is to understand what it is. A depth chart is a graphical representation of how much liquidity is available for a given cryptocurrency at a given price point. It can be used to help you determine whether or not it is worth purchasing a given cryptocurrency.
The most important thing to note about a depth chart is that it is not a prediction of future prices. The purpose of a depth chart is to show you the current liquidity levels for a given cryptocurrency.
To understand how to read a depth chart, you first need to understand what information is represented on the chart. On a depth chart, you will see three different types of information: buy orders, sell orders, and open orders.
Buy orders are orders from someone who wants to buy a given cryptocurrency. Sell orders are orders from someone who wants to sell a given cryptocurrency. Open orders are orders that are currently being sold by someone, but haven't been filled yet.
Each type of order will have different colors. The color of an order will tell you how much liquidity is available for that currency at that price point. For example, blue orders are usually bought and red orders are usually sold.
The purpose of a depth chart is to show you the current liquidity levels for a given cryptocurrency.
To understand how to read a depth chart, you first need to understand what information is represented on the chart.
On a depth chart, you will see three different types of information: buy orders, sell orders, and open orders.
Buy orders are orders from someone who wants to buy a given cryptocurrency. Sell orders are orders from someone who wants to sell a given cryptocurrency. Open orders are orders that are currently being sold by someone, but haven't been filled yet.
Each type of order will have different colors. The color of an order will tell you how much liquidity is available for that currency at that price point. For example, blue orders are usually bought and red orders are usually sold.
The purpose of a depth chart is to show you the current liquidity levels for a given cryptocurrency.
How to Use Depth Charts to Trade Cryptocurrency
There are a few ways to use depth charts to trade cryptocurrency.
One way is to use them to help determine when to enter and exit a trade. For example, if you see that the price of a cryptocurrency is trading at a certain level, you can use the depth chart to determine when to buy or sell.
Another way to use depth charts is to help you determine when to buy or sell based on the overall trend of the market. For example, if you see that the majority of the market is trading in a certain direction, you can use the depth chart to determine when to buy or sell.
The Benefits of Reading Depth Charts for Crypto Trading
Reading depth charts can help traders identify potential opportunities and avoid potential risks when trading cryptocurrencies.
Cryptocurrencies are complex and volatile assets, which means that it is important to have a strategy and a plan for trading them.
Reading depth charts can help traders identify patterns in price movement and make more informed decisions when trading cryptocurrencies.
For example, if you see a pattern in the prices of two different cryptocurrencies that mirrors each other, this may be an indication that there is a potential opportunity for you to make a financial gain by investing in both cryptocurrencies.
However, if you see a pattern in the prices of two cryptocurrencies that is not consistent with what you would expect to see, this may be an indication that there is a potential risk associated with investing in those cryptocurrencies.
So, by reading depth charts, you can identify potential opportunities and avoid potential risks while trading cryptocurrencies.
How to Get Started With Reading Depth Charts for Crypto
Reading depth charts are a powerful tool for understanding how a cryptocurrency is performing. They allow you to visualize how much of the available supply each coin has been mined, and how much is left.
To create a reading depth chart, first find the circulating supply of a cryptocurrency. This is the number of coins that are in circulation, plus any excess coins that have been burned (cancelled) or traded away.
Next, find the total number of coins that have been mined. This is found by multiplying the circulating supply by the blockchain hashing power.
Finally, find the number of coins left to be mined. This is found by subtracting the total number of coins mined from the total number of coins left to be mined.
How to Understand Depth Charts for Crypto Trading
When you are looking to trade cryptocurrencies, it is important to understand what depth charts are and how to use them. A depth chart is a graphical representation of how much a particular cryptocurrency is worth, relative to other cryptocurrencies.
The horizontal axis represents time, while the vertical axis represents the value of each cryptocurrency. The value of a cryptocurrency is represented by the height of the bar on the chart. The closer the value of a cryptocurrency is to the bottom of the chart, the more valuable that cryptocurrency is.
When you are looking at a cryptocurrency depth chart, you are looking for two things: trends and levels.
Trends: When you are looking at a cryptocurrency depth chart, you are looking for any changes in the trend. This could be an upward or downward trend, and it is important to keep an eye on it in order to make informed trading decisions.
Levels: When you are looking at a cryptocurrency depth chart, you are also looking for levels. Levels represent a point in time where the value of a cryptocurrency is stable. This could be a high or low point in the cryptocurrency's history, and it is important to keep an eye on it in order to make informed trading decisions.
What You Need to Know About Reading Depth Charts for Crypto
Reading depth charts for cryptocurrencies can help you understand how much money you could potentially make by investing in a particular coin. It can also help you decide which coins to avoid, as well as which coins to invest in.
The first step in reading a crypto depth chart is to determine the price of the coin. This is done by consulting an online resource, such as CoinMarketCap.com. After determining the price of the coin, you can then determine how much money you could potentially make by investing in that coin.
To do this, you will need to consult an online resource, such as CoinMarketCap.com. CoinMarketCap.com will list all of the coins on the market, as well as their prices and market capitalizations. You will then need to calculate how much money you could potentially make by investing in each coin.
You will need to calculate how much money you could potentially make by investing in each coin by consulting an online resource, such as CoinMarketCap.com. This will allow you to determine the potential return on investment (ROI) for each coin.
After calculating the ROI for each coin, you will be able to determine which coins to invest in and which coins to avoid.
How to Make the Most Out of Reading Depth Charts for Crypto
There are a lot of ways to make the most out of reading depth charts for crypto. Here are four tips:
1. Understand the Basics
Before you can understand how to read a depth chart, you need to understand the basics. This includes understanding what a depth chart is, what it shows, and how to use it.
2. Use a Trading Strategy
Once you understand how to read a depth chart, use it to help make your trading decisions. This includes using the information to find patterns, predict future movements, and optimize your trades.
3. Get Familiar with Different Cryptocurrencies
While reading depth charts is important, it’s also important to get familiar with the different cryptocurrencies. This includes understanding their underlying technologies, their market caps, and their current prices.
4. Stay Vigilant
Remember that while reading a depth chart is important, it’s also important to stay vigilant. This means watching for patterns and trends, and adjusting your trading strategies as necessary.
Why Reading Depth Charts is Important For Crypto Trading
Reading depth charts is one of the most important things you can do when trading cryptocurrencies. This is because they can help you to identify patterns in price movements and to make better investment decisions.
When you are looking at a depth chart, you are essentially seeing a visual representation of the order book. This is the list of assets that are currently being traded and is updated every few seconds.
The important thing to note is that the order book is always changing, which means that the information on the depth chart may not be accurate at any given time. However, it is a valuable tool for monitoring the market and for making informed investment decisions.
How to Read a Depth Chart
When you are looking at a depth chart, the first thing you need to do is to identify the asset you are interested in. You can do this by scrolling down the chart until you see the asset name, or by clicking on the asset symbol.
Once you have identified the asset, you will need to scroll down the chart until you see the order book. The order book is a list of all the orders that are currently being placed for the asset.
The important thing to note is that the order book is always changing, which means that the information on the depth chart may not be accurate at any given time. However, it is a valuable tool for monitoring the market and for making informed investment decisions.
How to Read Depth Charts Like a Pro
Depth charts are a great way to visualize and compare the relative strengths of different employees.
To read a depth chart like a pro, start by understanding what each column represents.
The top row represents the employee's rank. The next row down represents their job title. The remaining rows represent their job category (e.g. front-end, back-end, etc.).
The leftmost column represents the employee's total hours worked in the past week. The remaining columns represent how many hours they worked in their job category.
To read a depth chart, start by looking at the top row. This row represents the employee's rank.
Next, look at the job title column. This column will list the employee's job title.
Next, look at the job category column. This column will list the employee's job category.
Finally, look at the hours worked in the past week column. This column will list the employee's total hours worked in the past week.
The Ultimate Guide to Reading Depth Charts for Crypto Trading
Reading depth charts can be a helpful tool for crypto traders. Depth charts show the trading activity of a digital asset over time. By understanding how people are trading an asset, you can get a better idea of where the price is likely to go.
Here’s a guide to reading depth charts:
1. Look at the highest and lowest points on the chart. These are the areas where buyers and sellers are most active.
2. Look at the lines that connect the highs and lows. These are the price boundaries where buyers and sellers are most active.
3. Look at the areas in between the price boundaries. These are the zones where buyers and sellers are slightly less active.
4. Look at how the price has moved within each zone. This will give you an idea of how active the buyers and sellers are.
How to Read Depth Charts and Win at Crypto Trading
When you are looking to trade cryptocurrencies, one of the most important things to do is to understand depth charts. Depth charts are a graphical representation of what is happening on a given market and can help you make informed decisions about which cryptocurrencies to buy and sell.
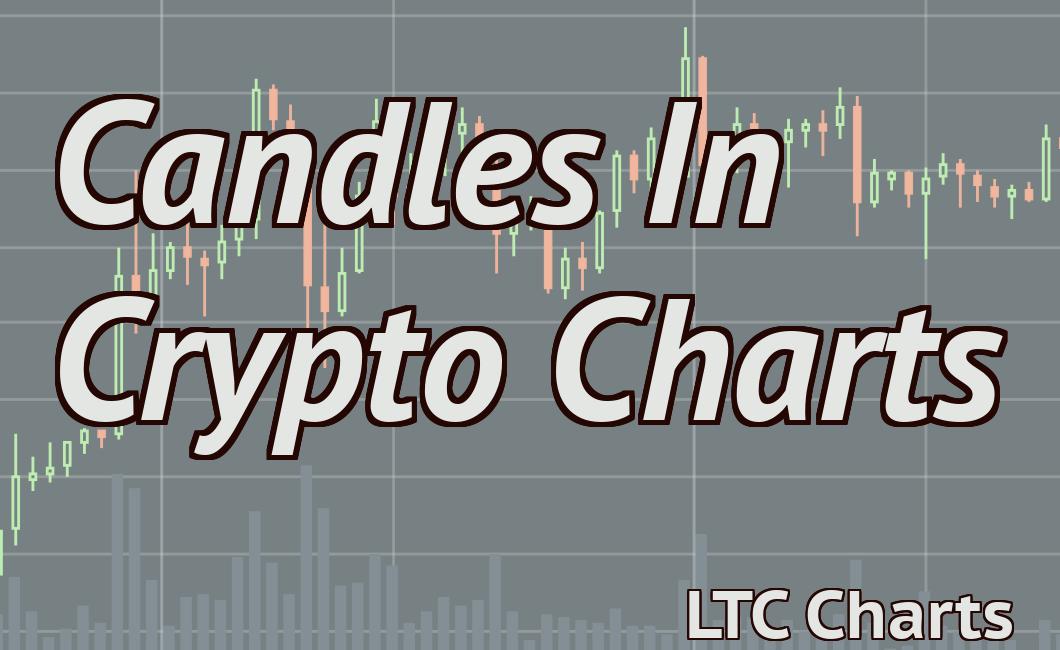
To read a depth chart, you first need to understand what a candlestick is. Candlesticks are a type of graphical representation of price movements and are used in many different types of markets. A candlestick consists of two parts: the body and the candle handle. The body is the portion of the candlestick that shows the actual price movement, and the candle handle is the part that points to the next candlestick.
When you are looking at a depth chart, you want to focus on the candles near the bottom of the chart. These are the candles that have been bought and sold the most, and they are usually indicative of what is happening on the whole market. You can use this information to make informed decisions about which cryptocurrencies to buy or sell.
For example, if you see that a cryptocurrency is being traded heavily near the bottom of the chart, this might be a good time to buy that cryptocurrency. If the market starts to move higher, the cryptocurrency might become more expensive, and you could make a profit by selling it at a higher price.
Depth charts are an important part of trading cryptocurrencies, and knowing how to read them can help you make informed decisions about which cryptocurrencies to buy and sell.
How to Read Depth Charts and Master the Art of Crypto Trading
Introduction
Cryptocurrencies are a highly volatile and complex investment. As such, it is important to have a sound understanding of how to read depth charts and trade in order to make sound investment decisions.
This guide will teach you how to read depth charts and trade cryptocurrencies correctly.
What is a Depth Chart?
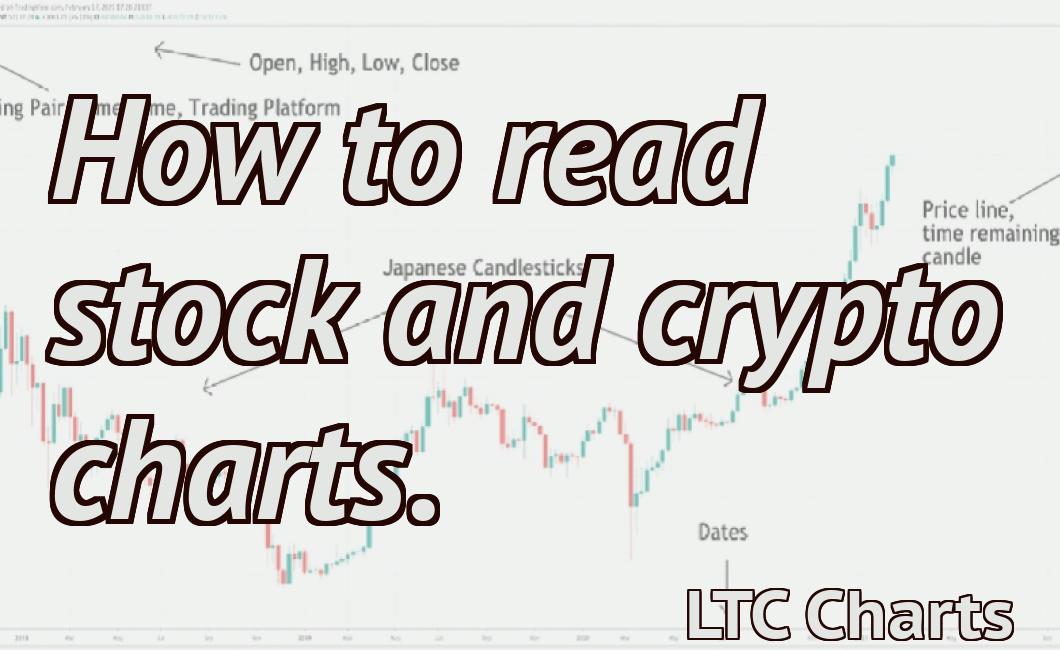
A depth chart is a graphical representation of a stock's price movements over time. It can be used to identify trends, spot market opportunities, and predict future price movements.
The horizontal axis represents time, and the vertical axis represents price. The closer two points are on the chart, the more closely they are related to each other.
Each "bar" on the chart represents a trading day. The height of the bar indicates the volume of shares traded during that particular day.
How to Read a Depth Chart
1. Identify the trend. Look for patterns in the chart that suggest a particular trend is taking place. For example, if the chart shows a gradual increase in price over time, this may be indicative of a long-term trend.
2. Spot market opportunities. If you see an opportunity to buy or sell a cryptocurrency at a lower price than what is currently being traded, take advantage of it.
3. Predict future price movements. Try to predict where the price of a cryptocurrency is likely to go next. This can be difficult, but by studying the chart and understanding how people are trading it, you can make better predictions.
4. Take action. If you see an opportunity to buy or sell a cryptocurrency, take action immediately. Don't wait for it to reach a predetermined price point – if it's too late, the opportunity may be gone forever.