How to understand crypto trading charts.
If you want to get into cryptocurrency trading, you need to be able to read and understand crypto trading charts. This guide will explain the basics of what you need to know in order to interpret these charts. Cryptocurrency trading charts can be confusing at first glance. However, once you learn how to read them, they can provide a wealth of information about the market. The most important thing to remember is that the price of a cryptocurrency is constantly changing. The first thing you need to do is identify the time frame that you want to look at. The most popular time frames are 1-hour, 4-hour, and daily. Once you have selected a time frame, you will need to find the appropriate chart. There are many different types of crypto trading charts. The most popular ones are candlestick charts and bar charts. Candlestick charts provide more detailed information than bar charts. Once you have selected a chart, you need to identify the various elements that make up the chart. The most important element is the price action. This is represented by the candlesticks or bars on the chart. The next thing you need to do is identify the trend. The easiest way to do this is by looking at the moving averages. The moving averages are lines that smooth out the price action and make it easier to identify the direction of the trend. Trendlines are another important element of crypto trading charts. These are lines that connect highs and lows and help to identify reversals. Support and resistance levels are also important elements of crypto trading charts. These are price levels where the market has difficulty breaking through. They can be used to enter or exit trades. Finally, you need to pay attention to volume. This is the number of shares or contracts that have been traded in a given period of time. High volume indicates that there is a lot of interest in a particular asset, while low volume indicates that there is less interest.
How to understand crypto trading charts: A beginner's guide
Crypto trading charts are a way for investors to track the performance of their cryptocurrency portfolios. They show the prices of cryptocurrencies over time, and can be used to identify trends and make informed investment decisions.
When viewing crypto trading charts, it is important to understand the different types of charts and how they are used. There are three main types of crypto trading charts:
1. Time-based charts
Time-based charts show the price of a cryptocurrency over a given period of time, usually 24 hours. This type of chart is useful for tracking short-term movements.
2. Volume-based charts
Volume-based charts show the amount of cryptocurrency traded over a given period of time. This type of chart is useful for tracking long-term movements.
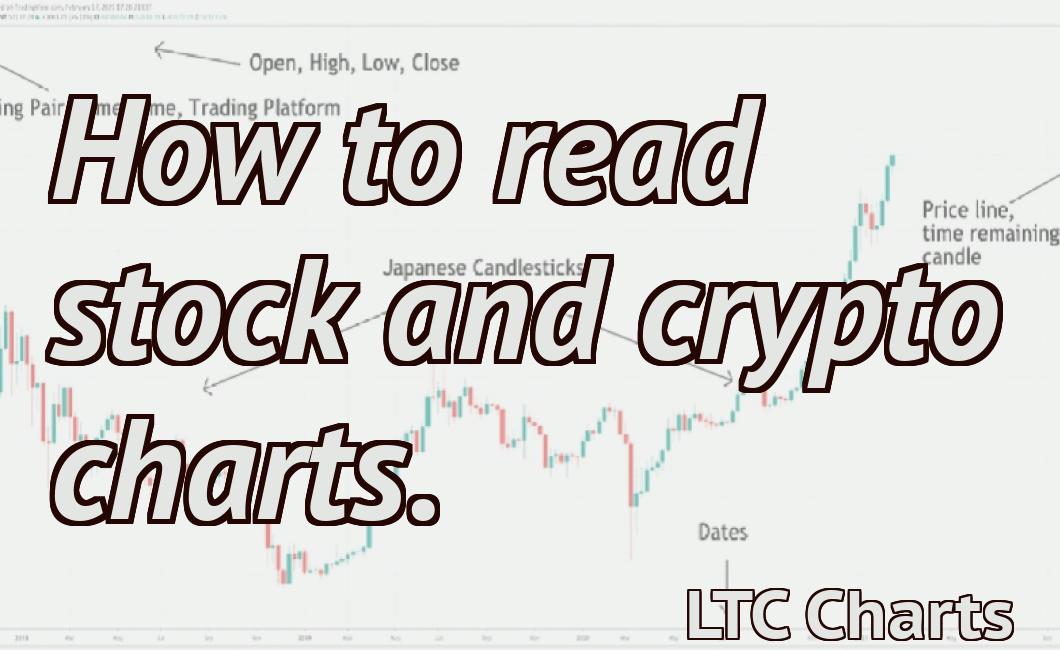
3. Candlestick charts
Candlestick charts are a type of technical analysis chart that shows the prices of cryptocurrencies using simple symbols. For example, a candlestick might show the price of a cryptocurrency at the top, the price at the bottom, and the volume (the number of coins traded) over the course of a given period of time. Candlestick charts are useful for tracking short-term movements and can be used to identify trends.
How to read crypto trading charts: A guide for beginners
Cryptocurrency trading can be a very lucrative investment, but it can also be extremely risky. Before you start trading cryptocurrencies, it’s important to understand how to read crypto trading charts.
The first step is to understand the different types of charts that are available. There are two main types of charts: time and price.
Time charts show you how the cryptocurrency is performing over a specific period of time. This can be useful if you want to know how the cryptocurrency is performing over the past day, week, or month.
Price charts show you how the cryptocurrency is performing against a specific currency or another cryptocurrency. This can be useful if you want to know how the cryptocurrency is performing against the dollar, euro, or another cryptocurrency.
The next step is to understand the different types of indicators that are available on the crypto trading charts. There are three main types of indicators: moving averages, Bollinger bands, and Fibonacci retracements.
Moving averages show you how the cryptocurrency is performing over a specific period of time. This can be useful if you want to know how the cryptocurrency is performing over the past day, week, or month.
Bollinger bands show you how the cryptocurrency is performing against a specific band. This can be useful if you want to know how the cryptocurrency is performing against the upper or lower band.
Fibonacci retracements show you how the cryptocurrency is performing against a specific Fibonacci retracement. This can be useful if you want to know how the cryptocurrency is performing against the 50%, 100%, and 200% Fibonacci retracements.
How to interpret crypto trading charts: A beginner's guide
Cryptocurrencies are a type of digital asset that uses cryptography to secure its transactions and to control the creation of new units. Cryptocurrencies are decentralized, meaning they are not subject to government or financial institution control.
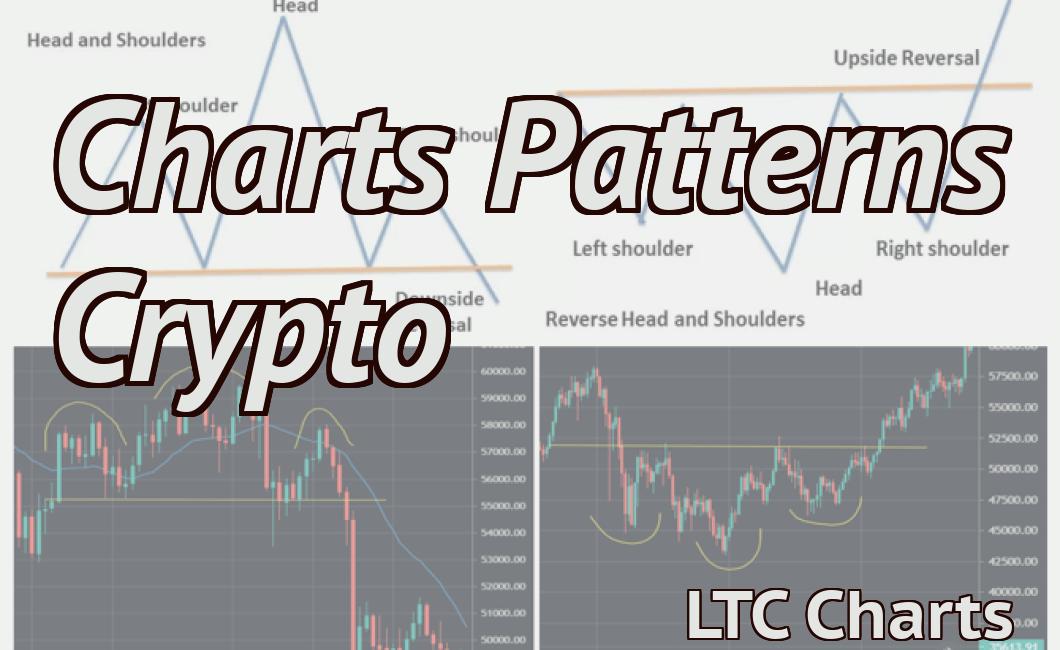
Cryptocurrency trading charts are used to predict the movement of prices of cryptocurrencies. Trading charts can be used to identify patterns in the price movements of cryptocurrencies over time.
When looking at a cryptocurrency trading chart, it is important to understand the different types of charts. The most common type of cryptocurrency trading chart is the time-based graph. This graph displays the price of a cryptocurrency over a specific period of time, such as a day, week, or month.
A candlestick chart is another popular type of cryptocurrency trading chart. Candlestick charts display the price of a cryptocurrency over a specific period of time, and each candlestick represents a sale or purchase of a cryptocurrency.
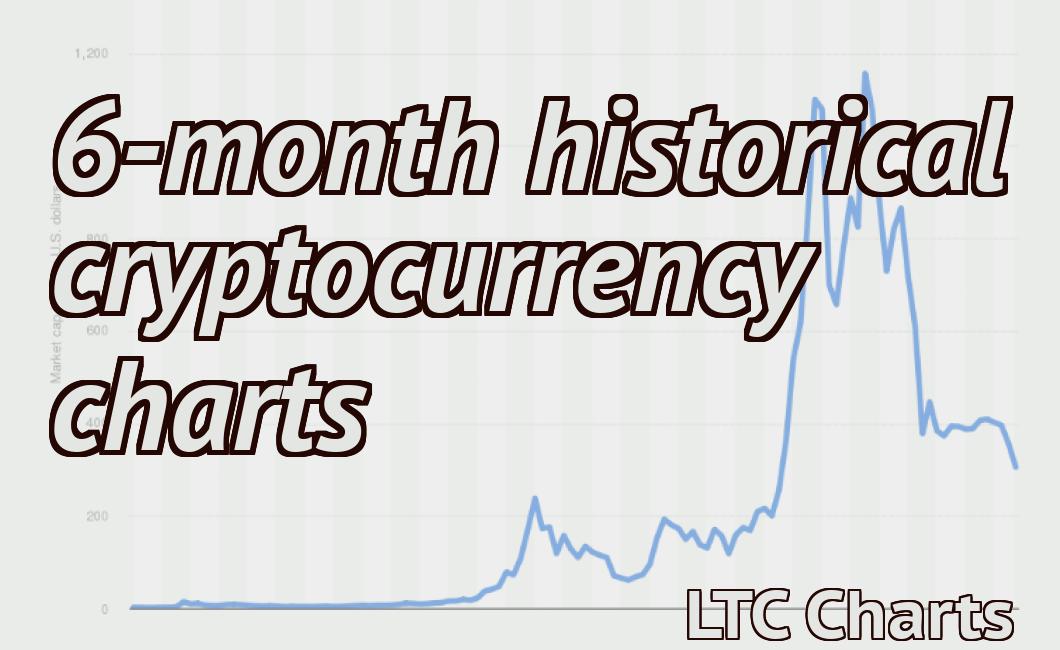
Cryptocurrency trading charts can also be used to track the market capitalization of a cryptocurrency. The market capitalization of a cryptocurrency is the total value of all outstanding units of that cryptocurrency.
How to make sense of crypto trading charts: A beginner's guide
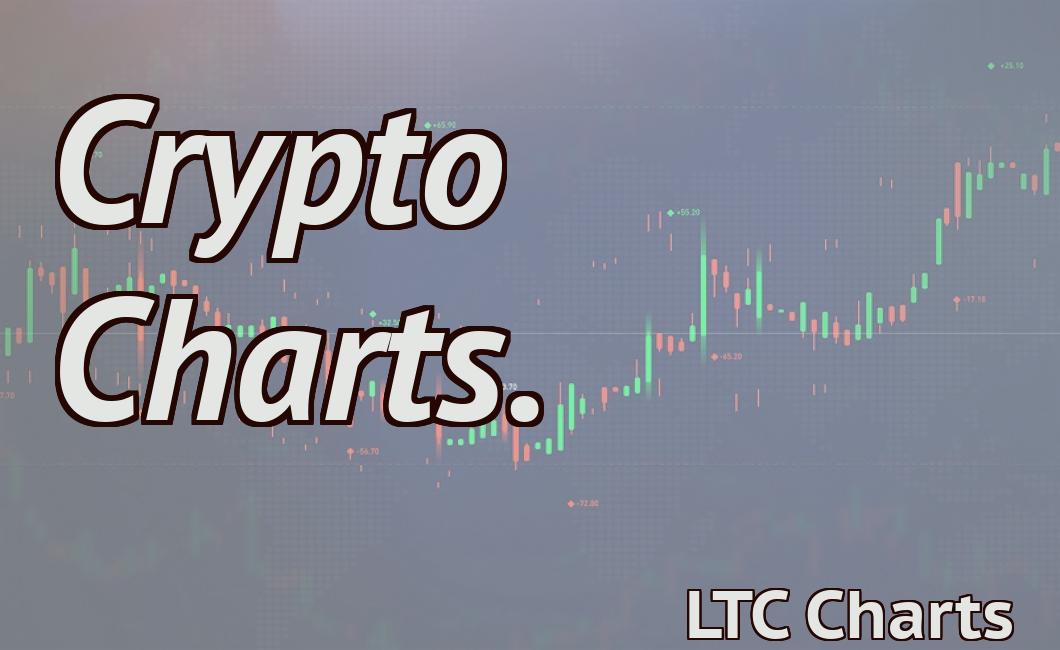
Crypto trading charts are essential for understanding the market. They allow traders to see how the prices of different cryptocurrencies are changing over time.
There are a few things to keep in mind when looking at crypto trading charts. First, it is important to understand what a chart actually is. A crypto trading chart is simply a graphical representation of how prices of different cryptocurrencies are changing over time.
Second, it is important to understand how to read a crypto trading chart. On a crypto trading chart, each column represents a different cryptocurrency. The leftmost column represents the lowest price of that cryptocurrency and the rightmost column represents the highest price. The middle column (between the left and right columns) represents the average price of that cryptocurrency.
Finally, it is important to understand how to use crypto trading charts. When looking at a crypto trading chart, traders should first identify the trend. Once they have identified the trend, they should look for opportunities to buy or sell cryptocurrencies based on the trend.
How to decipher crypto trading charts: A beginner's guide
Cryptocurrencies are a new kind of currency that use cryptography to secure their transactions and to control the creation of new units. Bitcoin, the first and most well-known cryptocurrency, was created in 2009. Cryptocurrencies are decentralized, meaning they are not subject to government or financial institution control.
Cryptocurrencies are traded on decentralized exchanges and can also be used to purchase goods and services. Trading cryptocurrencies is often difficult because prices can change rapidly and because there is no central repository where prices can be found.
To understand how to decode crypto trading charts, it is important to understand what a chart is and what it is not. A chart is a graphical representation of price movement over time. A chart can be used to spot trends and to identify areas of opportunity.
A chart is not a prediction of future price movement. It is not a tool that can be used to make investment decisions. A chart is not a legal document. It is not a contract.
How to decipher crypto trading charts: A beginner's guide
Cryptocurrency trading is a complex and speculative activity. Cryptocurrencies are digital or virtual tokens that use cryptography to secure their transactions and to control the creation of new units.
Cryptocurrencies are decentralized, meaning they are not subject to government or financial institution control. Bitcoin, the first and most well-known cryptocurrency, was created in 2009.
Cryptocurrencies are traded on decentralized exchanges and can also be used to purchase goods and services. Trading cryptocurrencies is a high-risk activity, and you may lose all your money. Before you start trading cryptocurrencies, you should learn about the risks involved.
In this guide, we will show you how to decipher crypto trading charts. We will explain what each chart shows and how to use it.
Cryptocurrency trading charts
Cryptocurrency trading charts show the price of a cryptocurrency over time. They can be used to track the price of a cryptocurrency, to predict how the price will change, and to analyze the market conditions.
There are two main types of cryptocurrency trading charts: candlestick charts and bar charts.
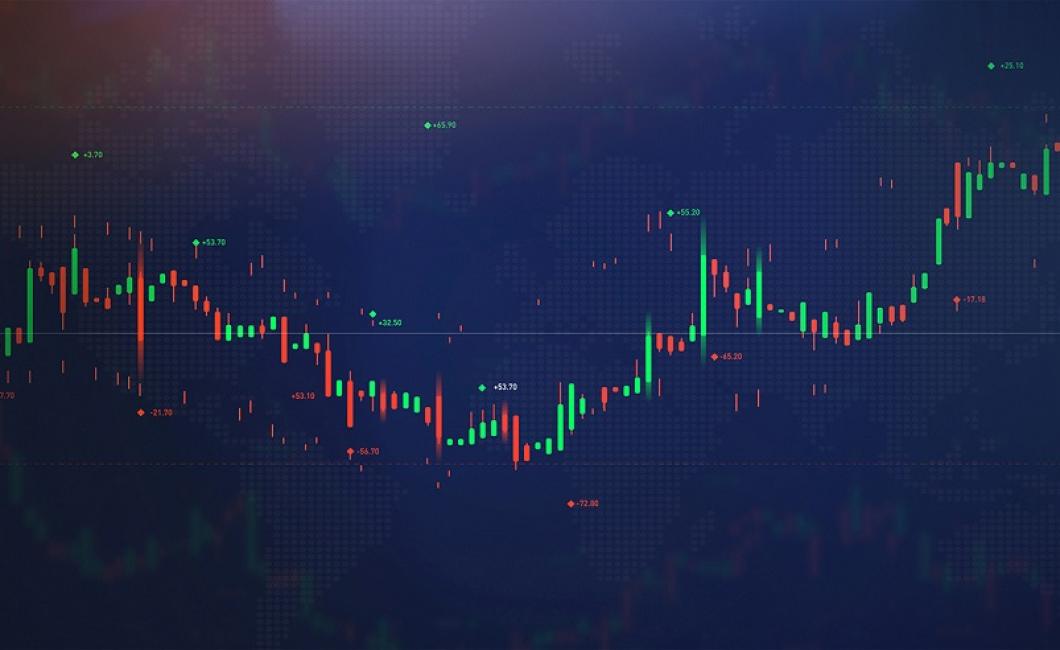
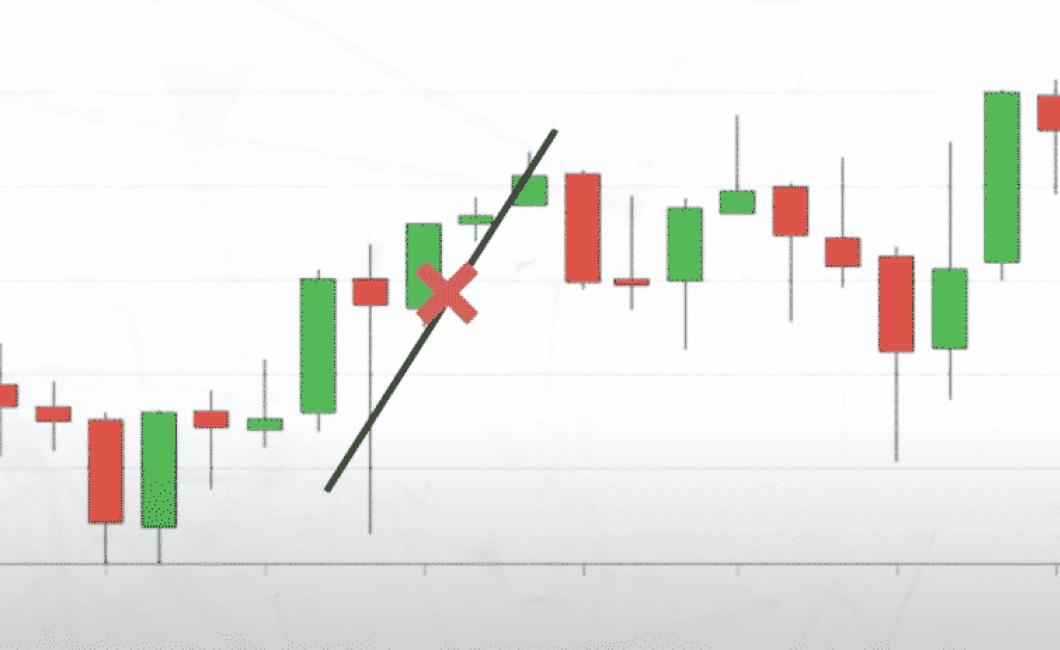
Candlestick charts
Candlestick charts are used to display the price of a cryptocurrency over time. They consist of a series of candlesticks, each representing a single point in time.
Each candlestick is filled with one of the following:
A white candle ( bullish ). This means that the price of the cryptocurrency has increased over the course of the chart.
). This means that the price of the cryptocurrency has increased over the course of the chart. A black candle ( bearish ). This means that the price of the cryptocurrency has decreased over the course of the chart.
). This means that the price of the cryptocurrency has decreased over the course of the chart. A green candle ( buying pressure ). This means that there is a lot of demand for the cryptocurrency, and the price is likely to increase in the future.
). This means that there is a lot of demand for the cryptocurrency, and the price is likely to increase in the future. A red candle ( selling pressure ). This means that there is a lot of demand for the cryptocurrency, and the price is likely to decrease in the future.
). This means that there is a lot of demand for the cryptocurrency, and the price is likely to decrease in the future. A black dotted line ( average ). This shows the average price over the course of the chart.
). This shows the average price over the course of the chart. A white dotted line ( moving average ). This shows the moving average over the course of the chart.
). This shows the moving average over the course of the chart. A color-coded area ( support/ resistance ). This indicates where the price is likely to change direction in the future.
). This indicates where the price is likely to change direction in the future. A size indicator (smaller numbers mean larger candles). This indicates how big the candles are.
Candlestick charts can be used to predict where the price of a cryptocurrency is going to go in the future. You can use this information to make trading decisions.
Bar charts
Bar charts are used to display the volume of a cryptocurrency over time. They consist of a series of bars, each representing a single transaction.
Each bar is filled with one of the following:
A green bar ( buying pressure ). This means that there is a lot of demand for the cryptocurrency, and the price is likely to increase in the future.
). This means that there is a lot of demand for the cryptocurrency, and the price is likely to increase in the future. A red bar ( selling pressure ). This means that there is a lot of demand for the cryptocurrency, and the price is likely to decrease in the future.
). This means that there is a lot of demand for the cryptocurrency, and the price is likely to decrease in the future. A black bar (negative volume ). This means that there was no volume associated with this transaction.
). This means that there was no volume associated with this transaction. A white bar (zero volume). This means that there was no volume associated with this transaction.
Bar charts can be used to determine how active the market is, and to predict where the price of a cryptocurrency is going to go in the future. You can use this information to make trading decisions.
How to understand crypto trading charts: An essential guide
Cryptocurrency trading is an exciting and rapidly growing industry. However, it can be confusing and difficult to understand the charts and indicators used to trade cryptocurrencies. This guide will provide an essential understanding of crypto trading charts, so that you can make informed decisions when trading cryptocurrencies.
What is a crypto trading chart?
A crypto trading chart is a graphical representation of the price of a cryptocurrency over time. It can be used to identify trends, make predictions about future prices, and assess the risk of investing in a cryptocurrency.
How are crypto trading charts created?
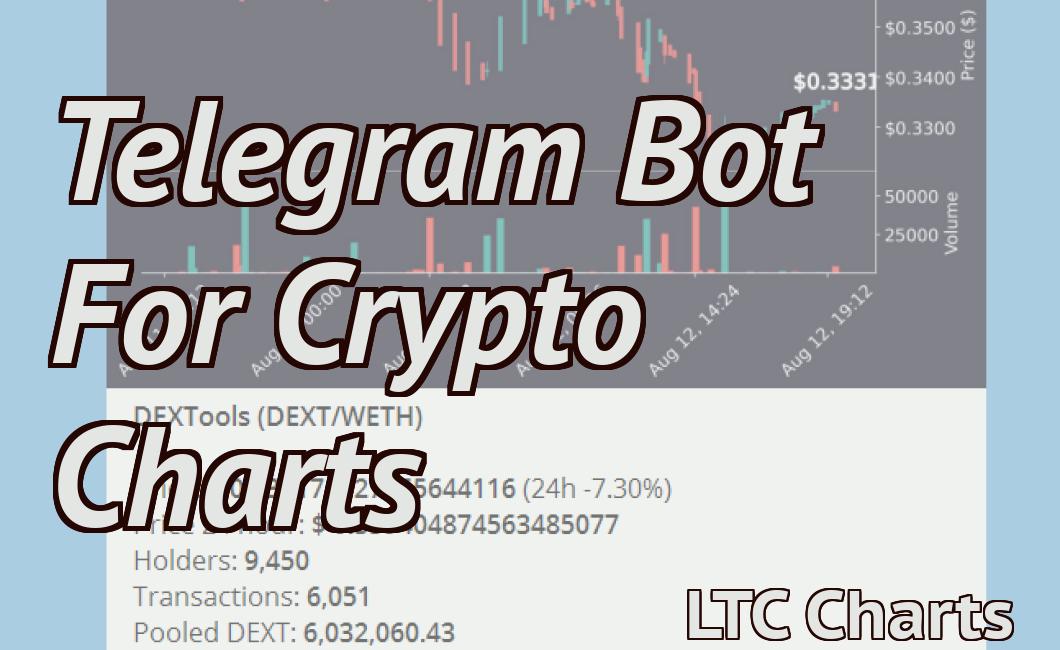
Cryptocurrencies are traded on digital exchanges, which generate a lot of data that needs to be processed and analyzed. To make this data easily accessible, many exchanges create their own crypto trading charts. These charts display the price of a cryptocurrency over time, as well as other data such as volume and market capitalization.
What are the benefits of using a crypto trading chart?
The main benefit of using a crypto trading chart is that it makes it easy to understand the trends and movements of a cryptocurrency. This information can help you make informed predictions about future prices, and assess the risk of investing in a cryptocurrency.
What are some common crypto trading charts?
Some common crypto trading charts include the following:
Bitcoin chart: This chart displays the price of Bitcoin over time. It is one of the most popular crypto trading charts, and is often used to track the movement of the Bitcoin price.
Ethereum chart: This chart displays the price of Ethereum over time. It is one of the most popular cryptocurrency trading charts, and is often used to track the movement of the Ethereum price.
Bitcoin cash chart: This chart displays the price of Bitcoin cash over time. Bitcoin cash is a new cryptocurrency that was created as a result of the Bitcoin Cash fork.
Litecoin chart: This chart displays the price of Litecoin over time. Litecoin is one of the most popular altcoins, and is often used to track the movement of the Litecoin price.
What are some tips for using a crypto trading chart?
To make the most use of a crypto trading chart, follow these tips:
1. Do your research: Before making any investment decisions, it is important to do your research. research the cryptocurrency you are interested in, and find out more about the charting platform and how it works.
2. Stay patient: It can take some time for a cryptocurrency to reach its peak or bottom, so patience is key when using a crypto trading chart. stay focused on the information presented on the chart, and don’t get distracted by other factors.
3. Be willing to take risks: While it is important to be patient when trading cryptocurrencies, it is also important to be willing to take risks. If you are not comfortable with taking risks, then you should probably avoid trading cryptocurrencies altogether.