Crypto Charts Reading
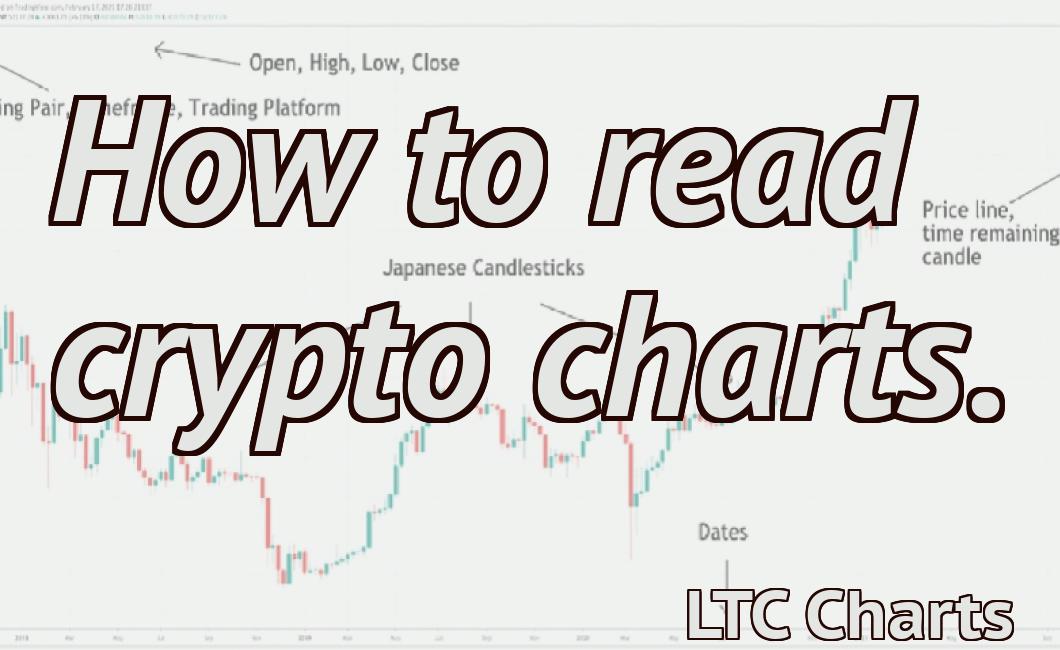
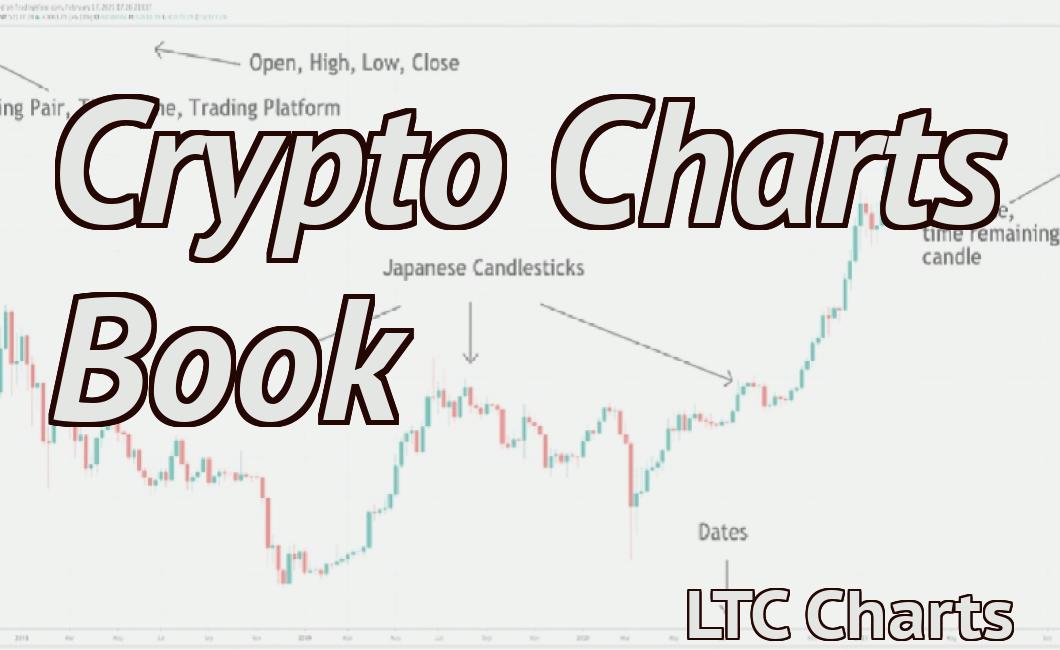
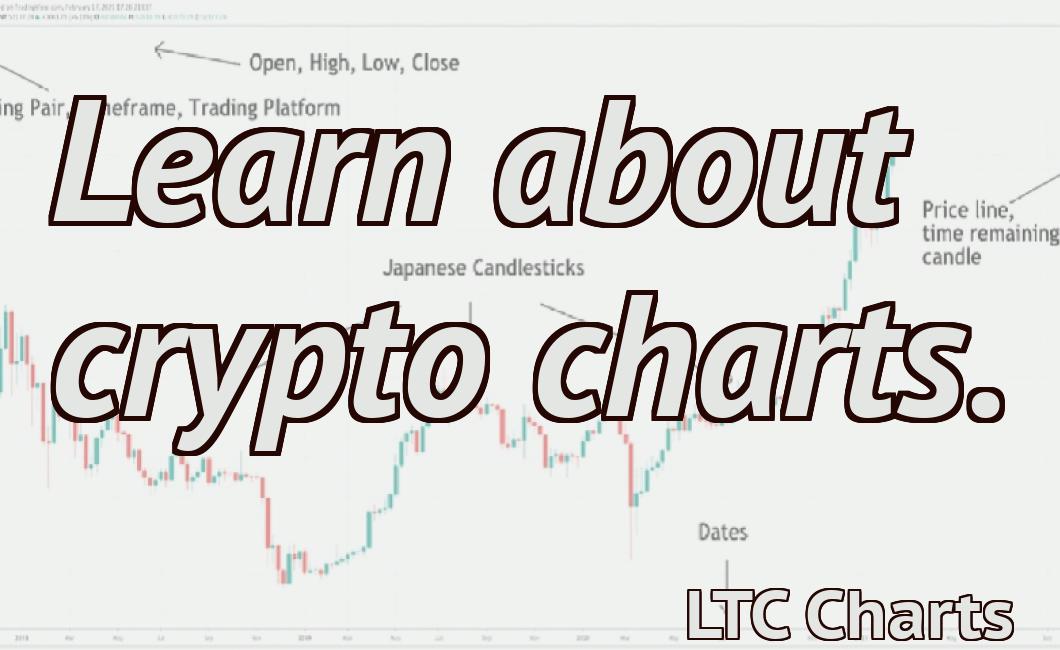
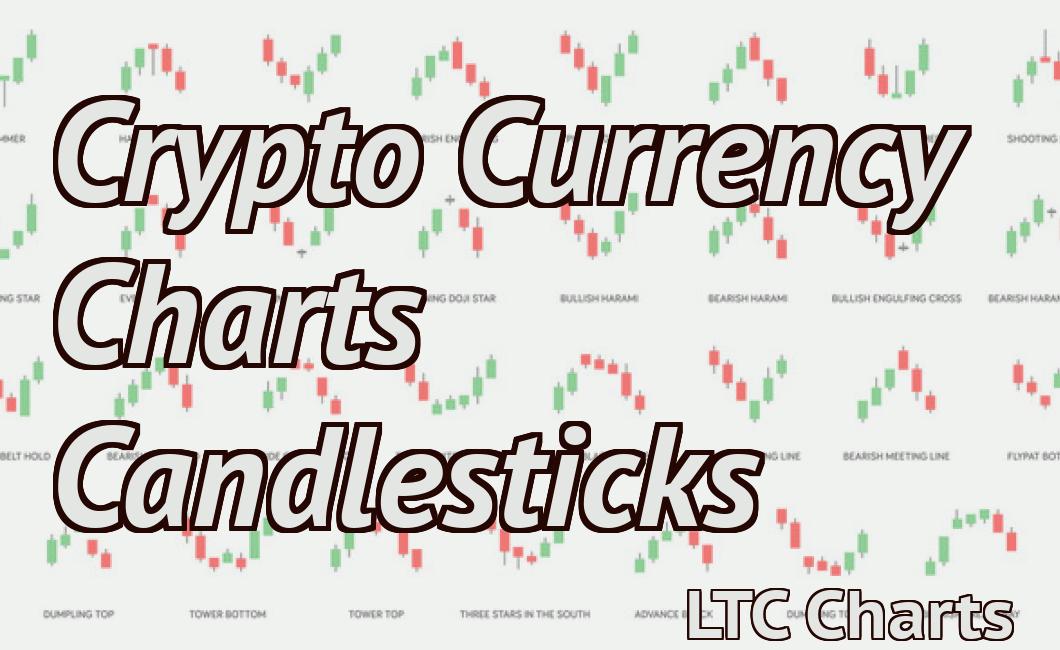
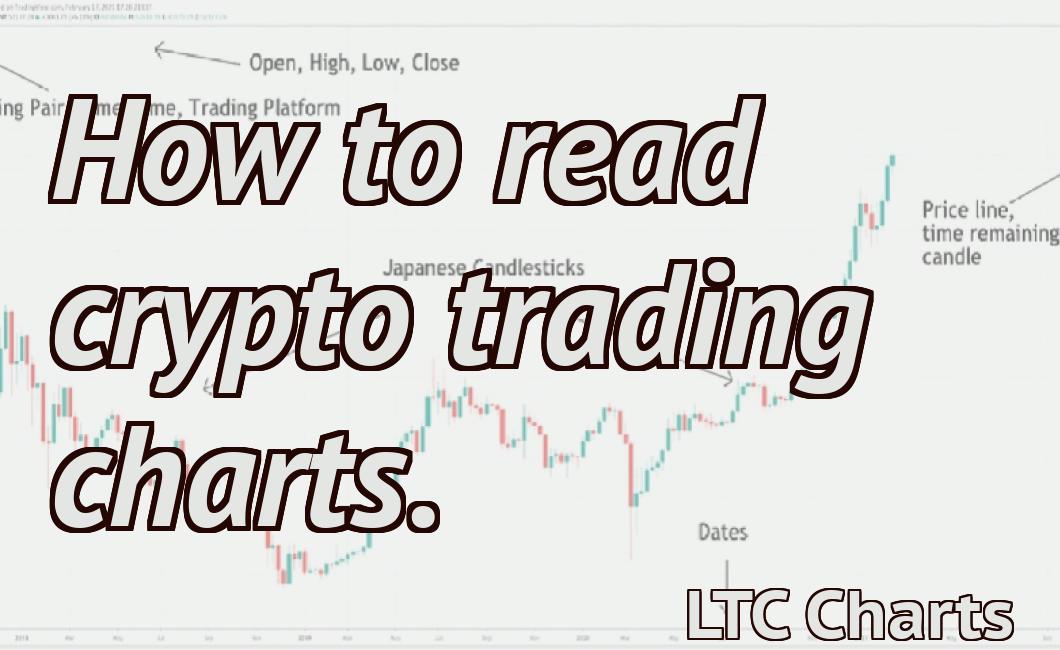
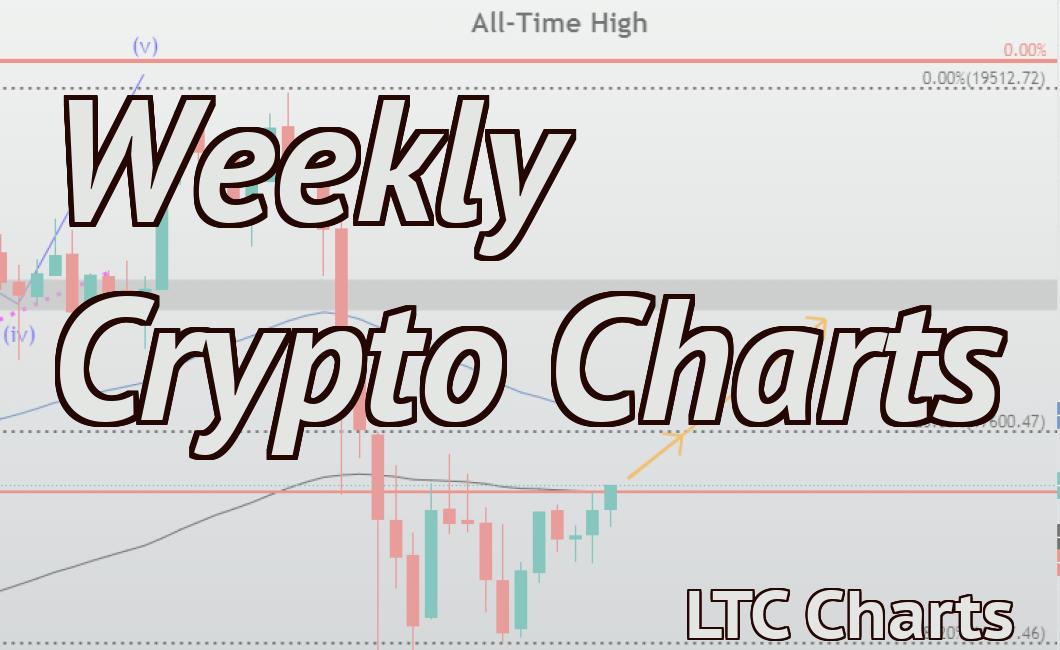
If you're new to the world of cryptocurrencies, you may be wondering how to read crypto charts. While they may look confusing at first, they're actually relatively simple to interpret. Here's a quick guide on how to read crypto charts so that you can start making informed investment decisions. The first thing to note is that there are two types of crypto charts: candlestick charts and line charts. Candlestick charts are the more popular of the two and provide more information. Each candlestick represents the price action for a specific time period, usually one day. The body of the candlestick indicates the open and close price for the period, while the wicks show the high and low prices. Line charts are simpler, only showing the closing price for each time period. However, this doesn't give you as much information as a candlestick chart. Once you've chosen which type of chart you want to use, you need to pay attention to the various elements. The most important element is the price, which is represented by a line on the chart. The x-axis shows the time period, while the y-axis indicates the price. You can also add other technical indicators to your chart to help you make investment decisions. Some popular indicators include moving averages, support and resistance levels, and Bollinger Bands. With this guide in hand, you should be able to start reading crypto charts like a pro!
Crypto Charts Reading for Beginners
Cryptocurrencies are digital or virtual tokens that use cryptography to secure their transactions and to control the creation of new units. Cryptocurrencies are decentralized, meaning they are not subject to government or financial institution control. Bitcoin, the first and most well-known cryptocurrency, was created in 2009.
Cryptocurrencies are often traded on decentralized exchanges and can also be used to purchase goods and services. Bitcoin is the most well-known cryptocurrency, but there are also dozens of other cryptocurrencies available.
How to Read Crypto Charts
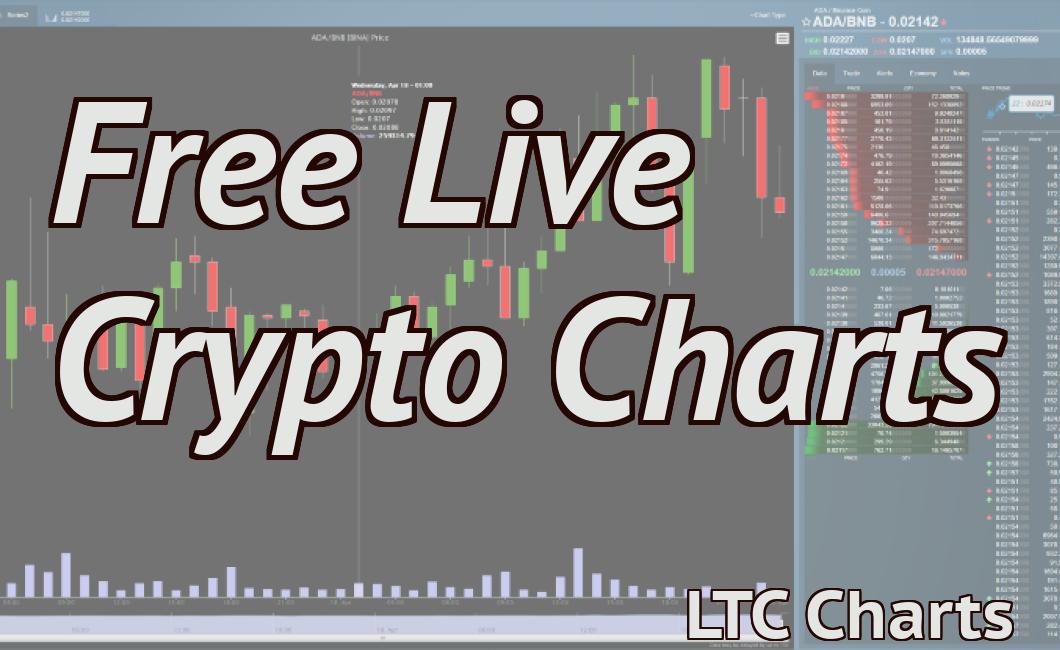
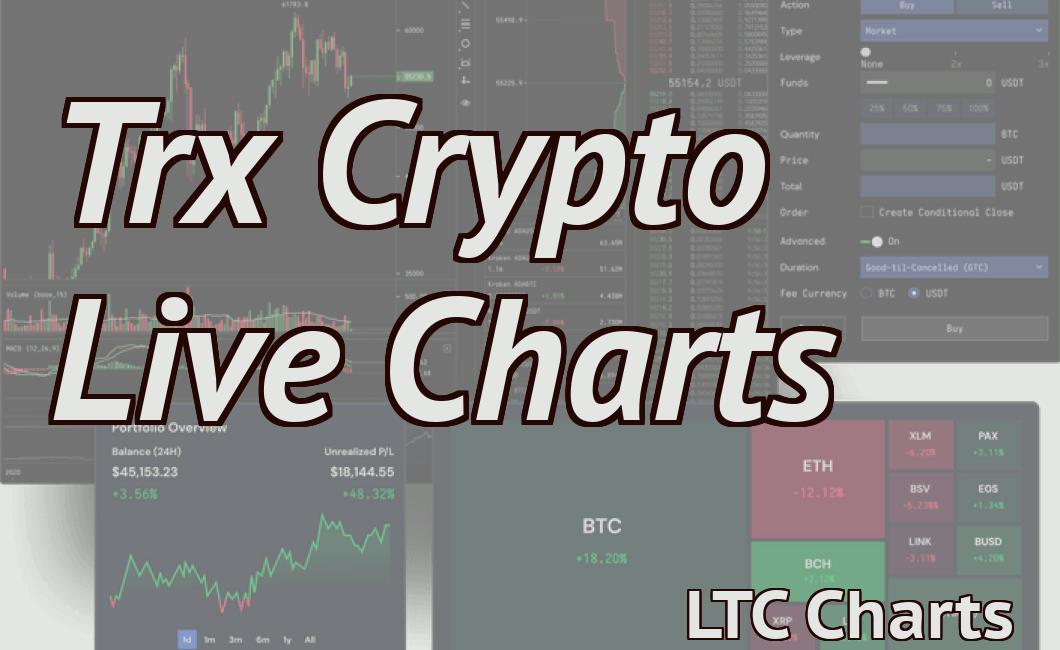
Crypto charts are a great way to keep track of the latest prices and movements for different cryptocurrencies.
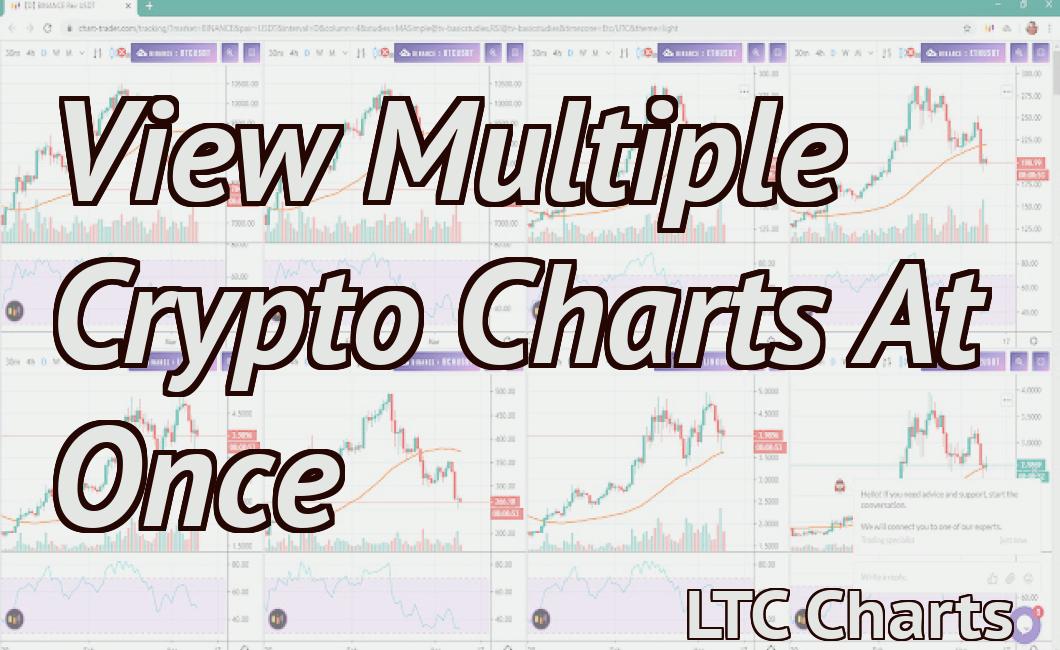
There are a few different ways to read crypto charts. You can either look at the overall market trends, look at specific cryptocurrencies, or look at specific exchanges.
Overall Crypto Trends
The first way to read crypto charts is to look at the overall market trends. This will show you how the market is performing overall, and which cryptocurrencies are performing the best.
You can also look at specific cryptocurrencies to see which ones are performing the best. This will give you an idea of which cryptocurrencies are worth investing in.
Exchanges
The second way to read crypto charts is to look at specific exchanges. This will give you an idea of the latest prices and movements for different cryptocurrencies.
You can also look at specific cryptocurrencies on specific exchanges to see how they are performing. This will give you an idea of which cryptocurrencies are worth investing in.
Beginner's Guide to Reading Crypto Charts
Cryptocurrency is a digital asset and a payment system invented by Satoshi Nakamoto. Cryptocurrencies are decentralized, meaning they are not subject to government or financial institution control. Cryptocurrencies are often traded on decentralized exchanges and can also be used to purchase goods and services.
Cryptocurrencies are volatile and can be highly risky, so it is important to do your research before investing. To help you understand cryptocurrency charts, we have created a beginner's guide.
What is a Cryptocurrency Chart?
A cryptocurrency chart is a graphical representation of a cryptocurrency's price movement over time. Cryptocurrency charts can be used to identify trends, monitor market activity, and make informed investment decisions.
How to Read a Cryptocurrency Chart
To read a cryptocurrency chart, first locate the period you want to examine. This will be either the current day, the past day, the past week, or the past month. After locating the period, locate the horizontal axis (usually labeled "time") and the vertical axis (usually labeled "price").
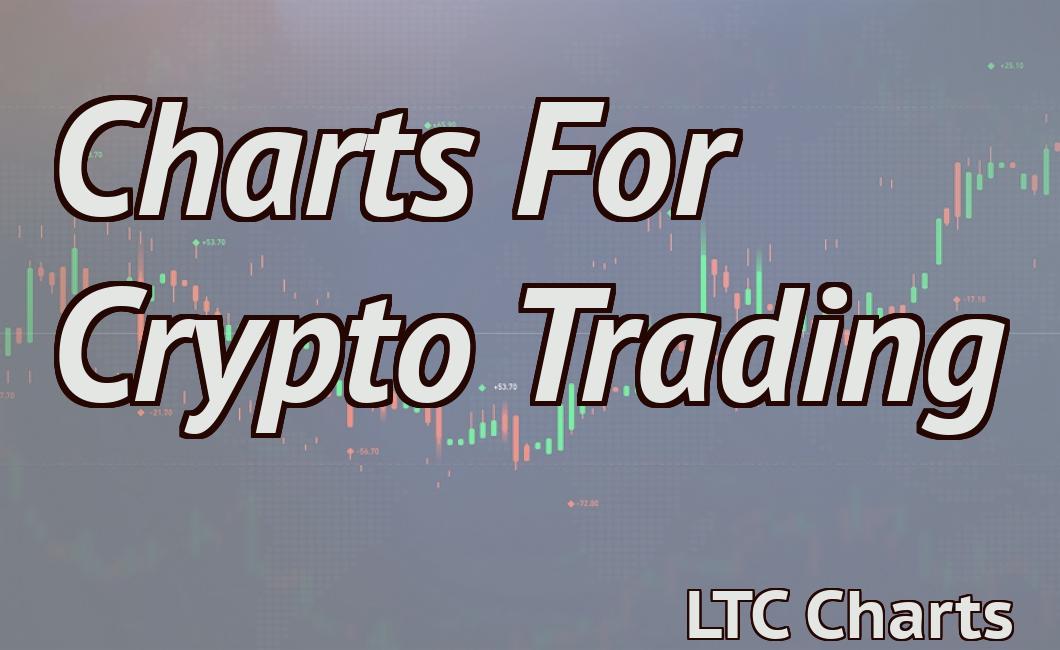
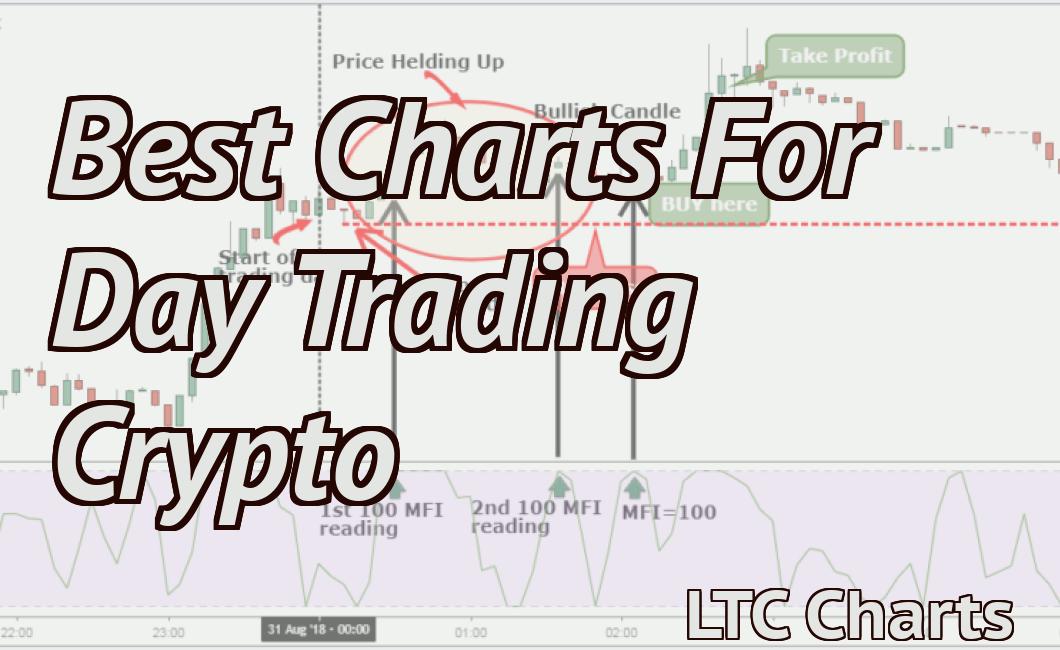
Next, look for areas of strong price movement. These areas will be highlighted in green on the chart. Once you have located a strong area of price movement, study it closely to see what caused it. For example, on a Bitcoin chart, you would study the green area near the $10,000 mark to see why it surged in value.
Finally, study the surrounding areas of the strong area to see if there are any indications of risk. For example, on a Bitcoin chart, you might look for areas of red candle patterns to indicate potential risks.
Cryptocurrency charts can be difficult to read, so it is important to use a trading platform that provides detailed charts. Trading platforms such as Poloniex and Bitfinex provide extensive charts that make it easy to understand cryptocurrency movements.
The Basics of Reading Crypto Charts
Cryptocurrency markets are constantly fluctuating and can be quite unpredictable. This is why it is important to pay attention to several key factors when analyzing crypto charts.
First and foremost, it is essential to consider the supply and demand of a given cryptocurrency. When there is a large amount of supply (e.g. Bitcoin), the price will be lower due to the abundance of the asset. Conversely, when there is a high demand for a cryptocurrency (e.g. Ethereum), the price will be higher due to the scarcity of the asset.
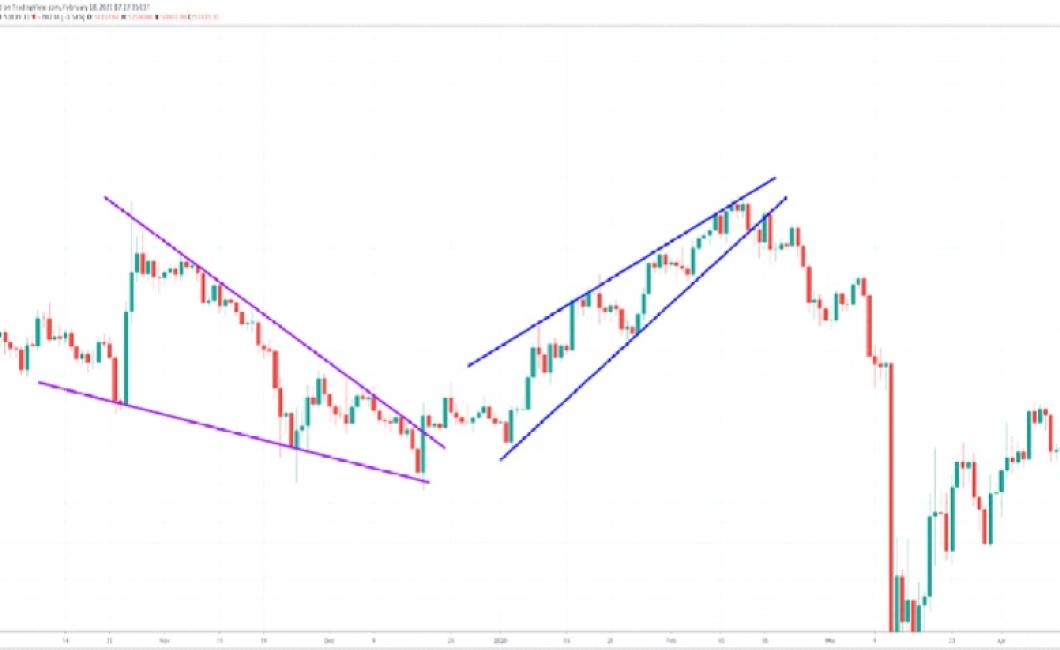
Secondly, it is important to look at the trend lines. If the price is stable, then the trend line will be flat. However, if the price is fluctuating significantly, then the trend line will be more curved. This is an indication of the overall sentiment of the market.
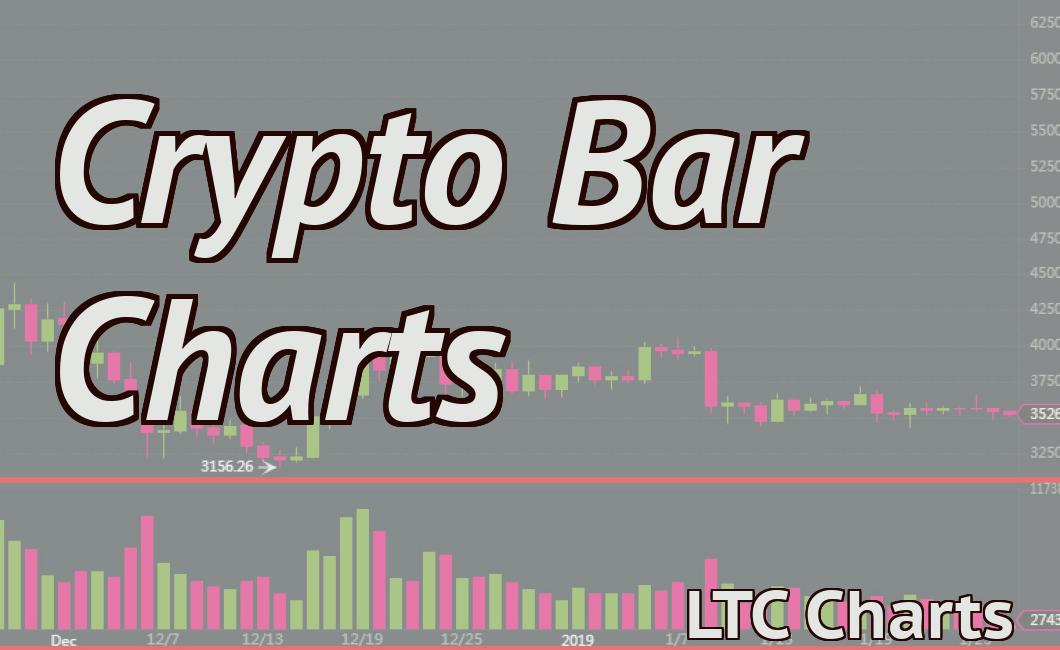
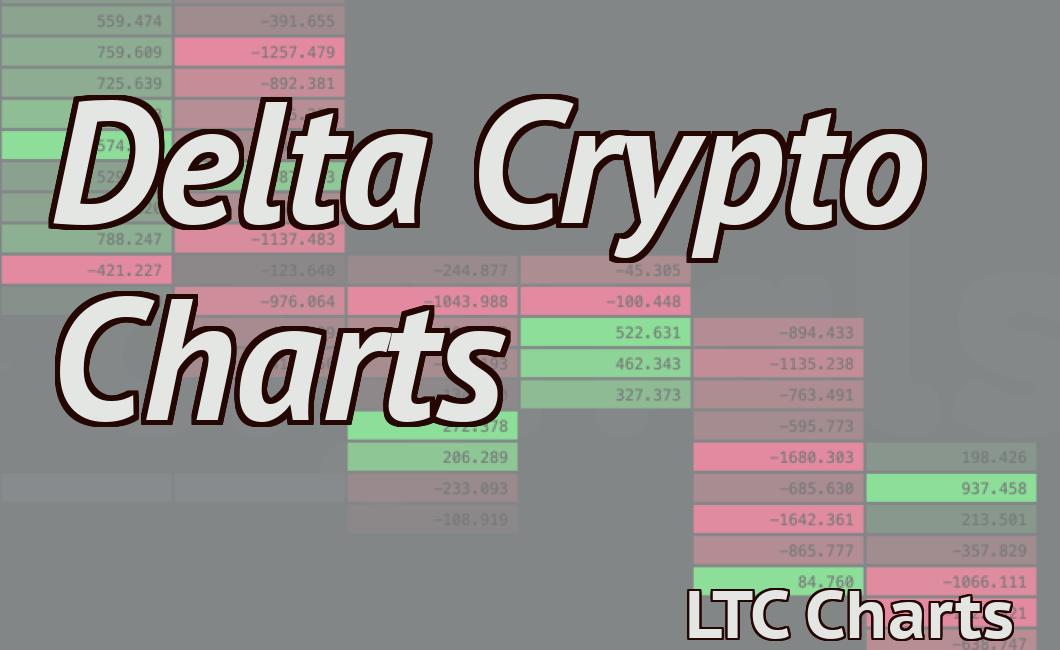
Finally, it is important to look at the volume of a given cryptocurrency. When the volume is high, it suggests that there is a lot of interest in that particular cryptocurrency. Conversely, when the volume is low, it suggests that the market is not very active.
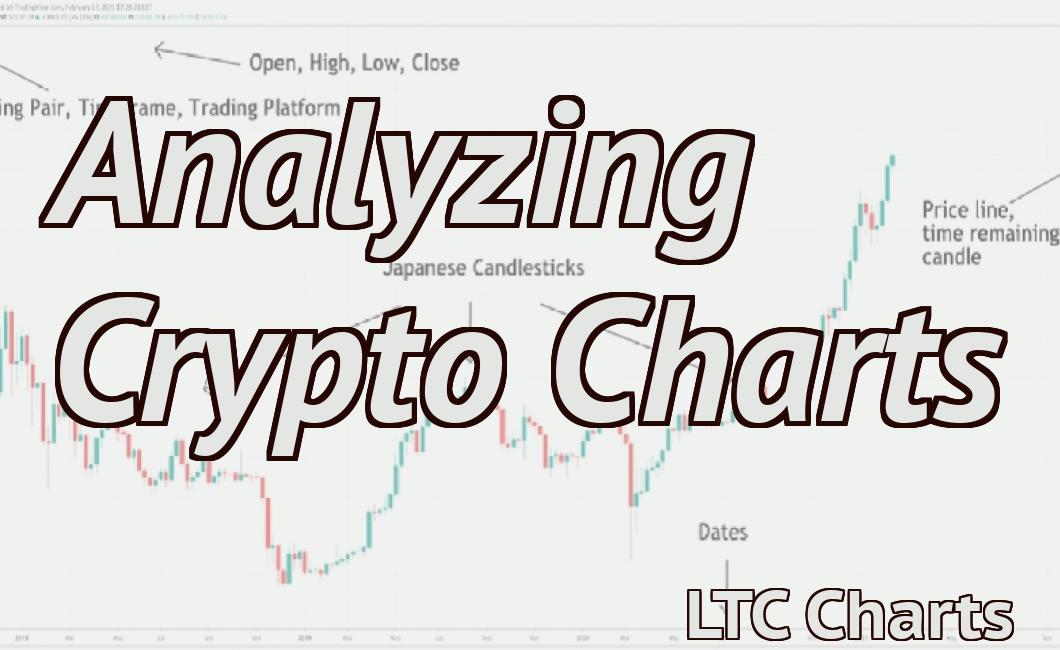
Interpreting Crypto Charts
Cryptocurrencies are often traded on a number of major exchanges and can be used to purchase goods and services. Cryptocurrencies are also used as an investment vehicle, and can increase in value over time.
Cryptocurrency charts show the price of a cryptocurrency over time. Crypto charts can be used to identify trends, spot opportunities, and assess risk.
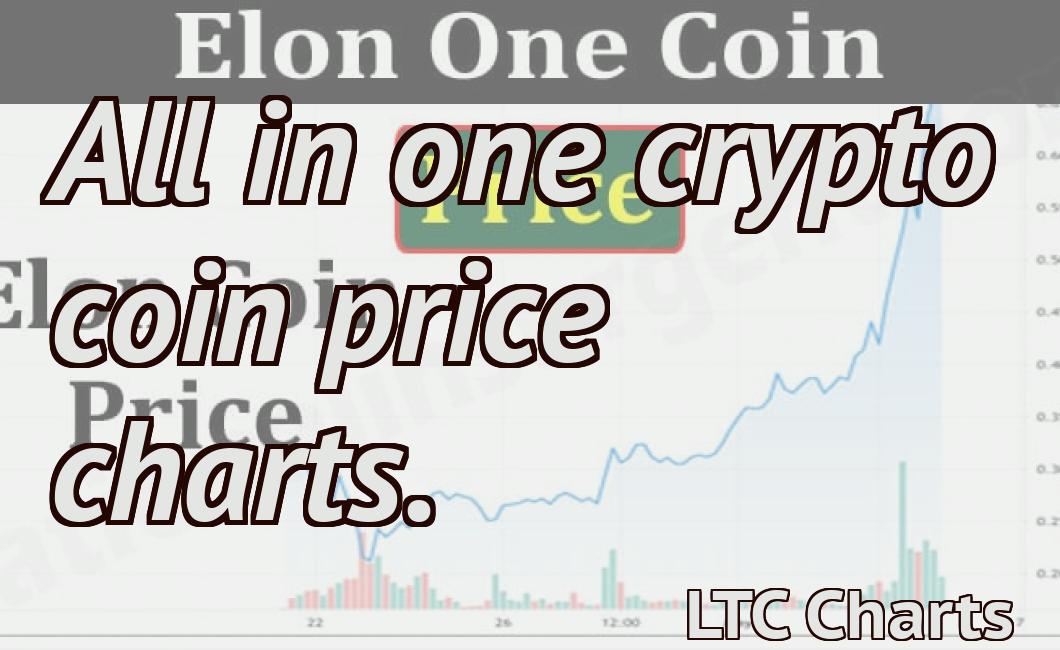
What do Crypto Charts Mean?
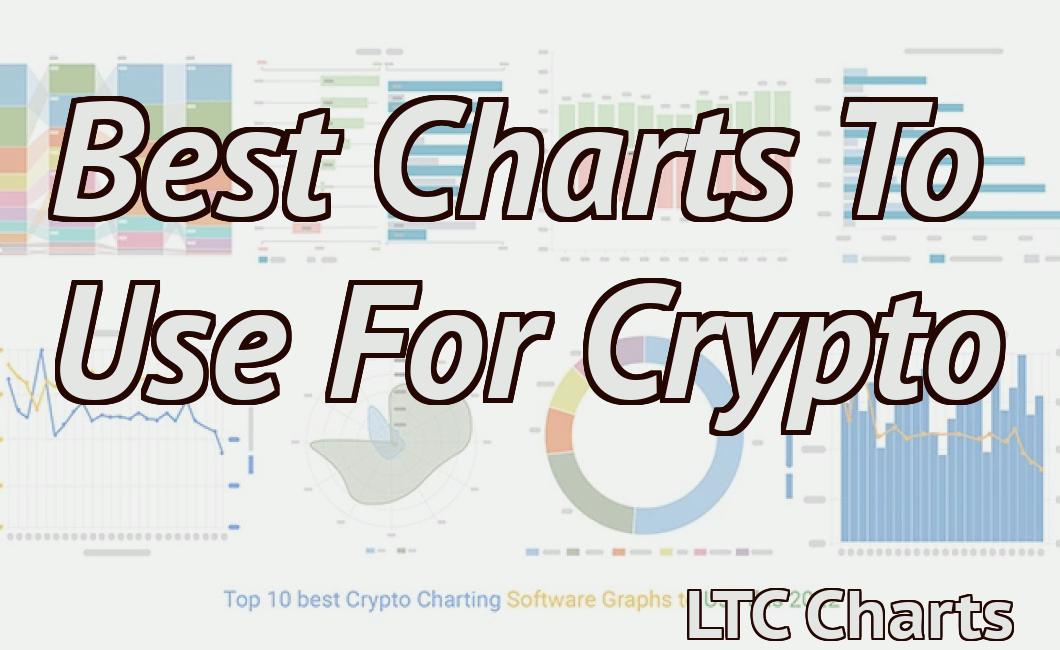
Crypto charts are used to track the performance of cryptocurrencies and other digital assets. They can be used to identify trends, measure market sentiment, and identify opportunities for investment.