How to view crypto charts?
If you want to view cryptocurrency charts, there are a few things you need to know. First, you need to find a reputable website or service that offers them. Once you have found a good one, you need to select the time frame you want to view the chart for. Finally, you need to choose the currency pairs you want to view.
How to View Crypto Charts – The Basics
Cryptocurrencies are digital or virtual tokens that use cryptography to secure their transactions and to control the creation of new units. Cryptocurrencies are decentralized, meaning they are not subject to government or financial institution control.
To view a cryptocurrency chart, you first need to find an appropriate website. There are many reputable sources, but some of the most well-known include CoinMarketCap and CoinGecko. Once you’ve found an appropriate website, you need to enter the name of the cryptocurrency you want to view the chart for. You can also find cryptocurrencies by their code name or ticker symbol.
After you’ve entered the name of the cryptocurrency, the website will display a list of all of the current prices and volumes for that currency. You can also view historical prices and volumes to get a better understanding of how the currency has been performing over time.
To move around the charts, you can use the left and right arrow buttons, or you can click on the different chart icons. You can also use the up and down arrow buttons to zoom in or out on the chart.
How to Read Crypto Charts
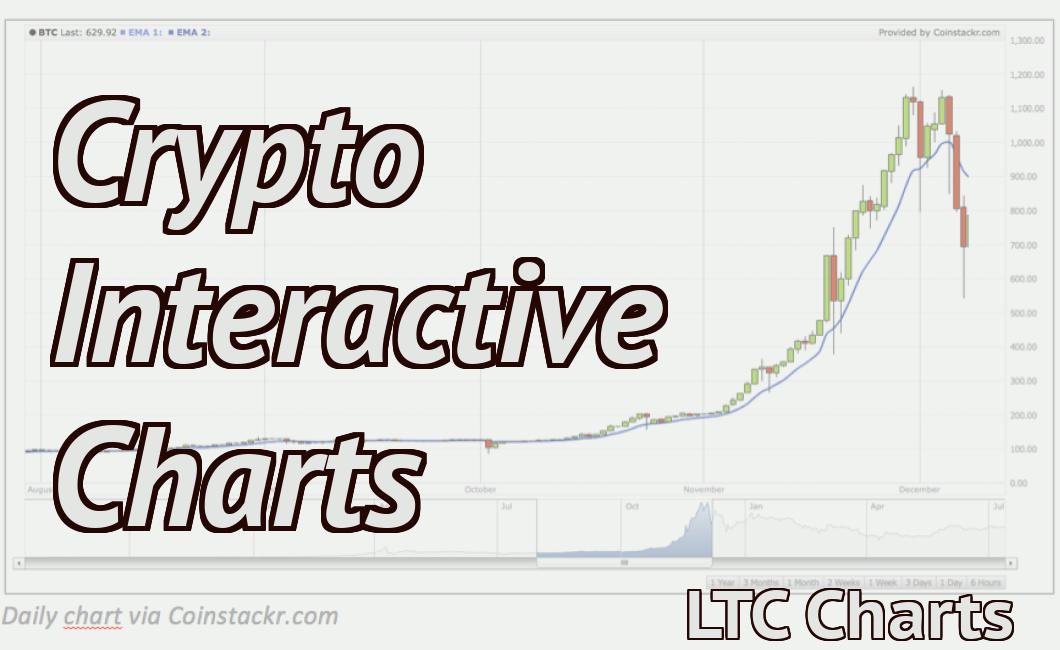
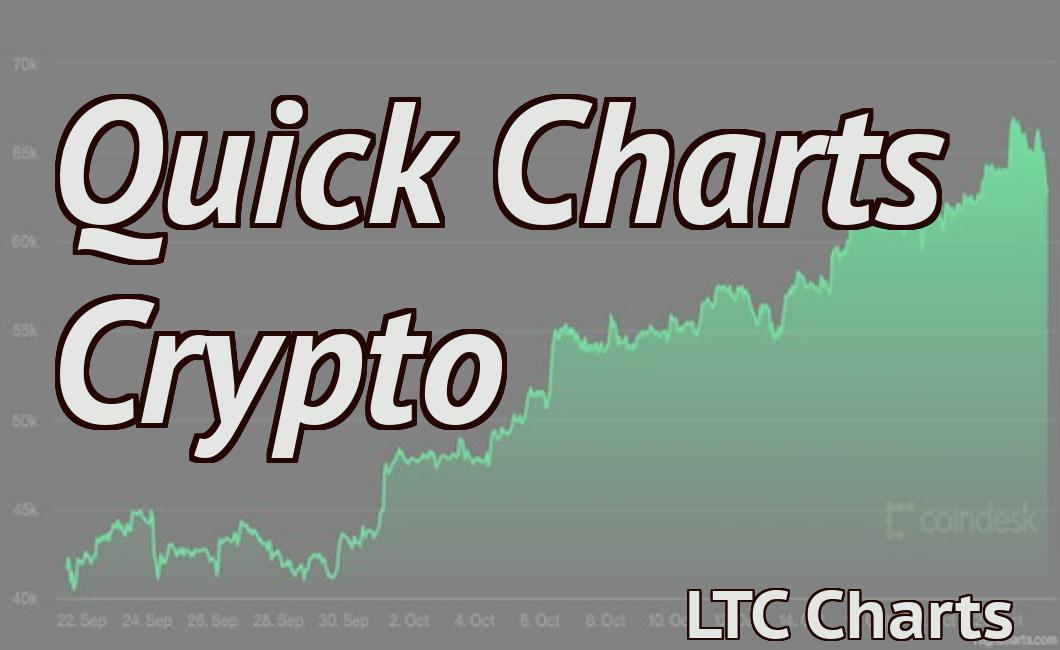
Cryptocurrency charts are made up of a series of lines that represent the movement of the price of a cryptocurrency over time. The horizontal axis represents time, and the vertical axis represents the price of a cryptocurrency.
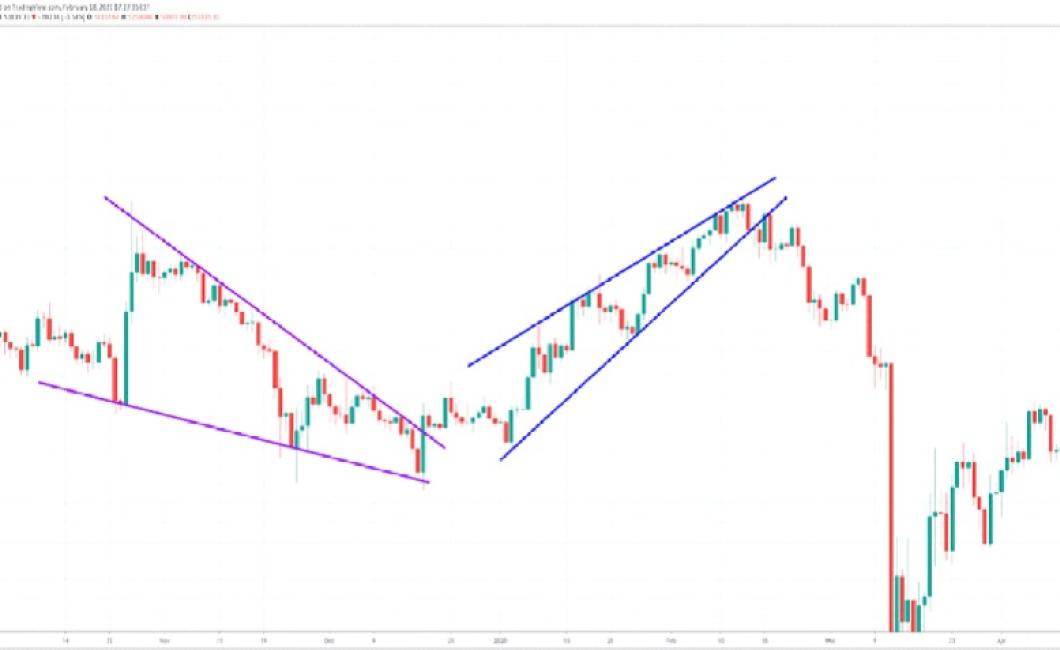
Cryptocurrency charts can be read in a number of ways. The most common way to read a cryptocurrency chart is to look for trends. You can look for patterns in the movement of the price of a cryptocurrency over time, and try to identify when the price of a cryptocurrency is about to go up or down.
Another way to read a cryptocurrency chart is to look for indications of support and resistance. When the price of a cryptocurrency is about to go up or down, you can look for areas on the chart where the price has stopped going down or up, and is instead staying at that same level. This is an indication that there is strong support or resistance at that particular level, and that the price is likely to stay at that level for a while.
How to Trade Based on Crypto Chart Analysis
Crypto chart analysis is the process of taking a look at a cryptocurrency’s chart and analyzing it to see how it is performing. This can help you determine whether or not it is a good time to buy or sell the cryptocurrency.
To trade based on crypto chart analysis, first make sure you have a reliable cryptocurrency trading platform. You can find some of the best platforms here. Once you have a platform, you need to find a good cryptocurrency to trade. To do this, you can use a variety of methods, including searching for coins on popular exchanges, reviewing trading volumes and prices on various exchanges, or using a technical analysis tool.
Once you have found a cryptocurrency to trade, you need to find a good entry point. This is the price at which you want to buy the cryptocurrency. You can find this price by using a variety of methods, including using a technical analysis tool, looking at the market cap of the cryptocurrency, or using trading volumes and prices on various exchanges.
Once you have found an entry point, you need to calculate your risk. This involves looking at the potential losses that you could incur if the price of the cryptocurrency falls below your entry point. You can do this by using a variety of methods, including using a technical analysis tool or looking at historical data.
Once you have calculated your risk, you can decide whether or not to buy the cryptocurrency. To do this, you need to find a seller who is willing to sell the cryptocurrency at your entry point. You can do this by using a variety of methods, including using trading volumes and prices on various exchanges or looking for sellers on popular forums. Once you have found a seller, you need to agree on a price and exchange information.
How to Use Crypto Charts to Make Better Trading Decisions
Crypto charts are a valuable tool for traders because they allow you to see the historical price action of various cryptocurrencies, and make better trading decisions based on this information.
When looking at crypto charts, it is important to understand what indicators to use, and how to use them. There are a number of popular crypto trading indicators that can be used to help make better decisions, including the following:
1. MACD
The MACD is a popular technical indicator that helps identify trends in prices. When used in conjunction with other indicators, it can help you identify when a cryptocurrency is in a buying or selling mood.
2. Bollinger Bands
Bollinger Bands are two lines on a chart that represent the range of prices that a cryptocurrency has been trading within over a certain period of time. They can help you identify when a cryptocurrency is oversold or overbought, and can help you identify potential buying and selling opportunities.
3. RSI
The RSI is a popular technical indicator that measures the momentum of a cryptocurrency. When used in conjunction with other indicators, it can help you identify when a cryptocurrency is in a buying or selling mood.
4. Fibonacci Retracements
Fibonacci retracements are technical analysis tools that allow you to draw Fibonacci levels in order to identify possible support and resistance points in a given market. When used in conjunction with other indicators, they can help you identify when a cryptocurrency is in a buying or selling mood.
The Benefits of Viewing Crypto Charts
Cryptocurrencies are a growing trend, with new ones being created all the time. For investors, this can be a great opportunity to gain exposure to new and untested assets.
Cryptocurrency charts can also be a useful tool for traders. By examining various charts, traders can get a better idea of how the market is moving and whether they should buy or sell a particular cryptocurrency.
Cryptocurrency charts can also be helpful for investors who want to know the price of a specific cryptocurrency over time. This information can be helpful in making informed investment decisions.
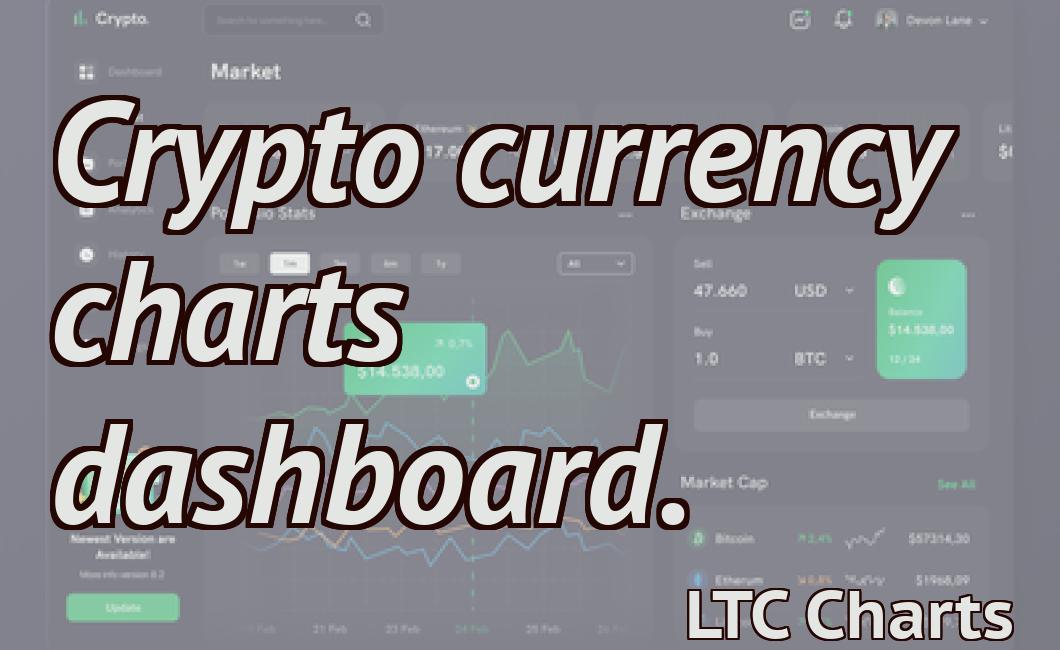
How to Get Started with Viewing Crypto Charts
The first step to viewing crypto charts is to open a cryptocurrency wallet. This is where you will store your coins and tokens. Once you have opened a cryptocurrency wallet, you will need to find a reputable cryptocurrency exchange where you can trade your coins and tokens.
Once you have found a reputable cryptocurrency exchange, you will need to sign up for an account. After you have signed up for an account, you will need to deposit some of your coins and tokens into your account. After you have deposited your coins and tokens, you will need to find the cryptocurrency charts section of the exchange.
After you have found the cryptocurrency charts section of the exchange, you will need to sign in to your account. After you have signed in to your account, you will need to find the “Charts” tab. After you have found the “Charts” tab, you will need to find the “Cryptocurrency Charts” section.
After you have found the “Cryptocurrency Charts” section, you will need to find the “Bitcoin” tab. After you have found the “Bitcoin” tab, you will need to find the “Bitcoin Chart” section. After you have found the “Bitcoin Chart” section, you will need to find the “Ethereum” tab. After you have found the “Ethereum” tab, you will need to find the “Ethereum Chart” section.
After you have found the “Ethereum Chart” section, you will need to find the “Bitcoin Cash” tab. After you have found the “Bitcoin Cash” tab, you will need to find the “Bitcoin Cash Chart” section. After you have found the “Bitcoin Cash Chart” section, you will need to find the “Litecoin” tab. After you have found the “Litecoin” tab, you will need to find the “Litecoin Chart” section.
After you have found the “Litecoin Chart” section, you will need to find the “Dogecoin” tab. After you have found the “Dogecoin” tab, you will need to find the “Dogecoin Chart” section. After you have found the “Dogecoin Chart” section, you will be able to view all of the charts for cryptocurrencies that are listed on the exchange.
What You Need to Know About Viewing Crypto Charts
Cryptocurrencies are digital or virtual tokens that use cryptography to secure their transactions and to control the creation of new units. Bitcoin, the first and most well-known cryptocurrency, was created in 2009.
Cryptocurrencies are decentralized, meaning they are not subject to government or financial institution control. This makes them attractive to investors because they are not subject to the whims of a single party or institution.
Cryptocurrencies are often traded on decentralized exchanges, which are websites where buyers and sellers can trade cryptocurrencies without needing to go through a third party.
Cryptocurrencies are not legal tender, so they cannot be used to purchase goods or services. However, some vendors are starting to accept cryptocurrencies as payment.
Cryptocurrencies are volatile, which means their prices can change rapidly. This makes them risky investments, and it is important to do your research before investing in them.
The Different Types of Crypto Charts You Can Use
Cryptocurrency charts are important for traders for a few reasons. They can help you track the price of a particular cryptocurrency over time, and they can give you an idea of how volatile a particular cryptocurrency is.
There are a few different types of cryptocurrency charts you can use, and each has its own advantages and disadvantages.
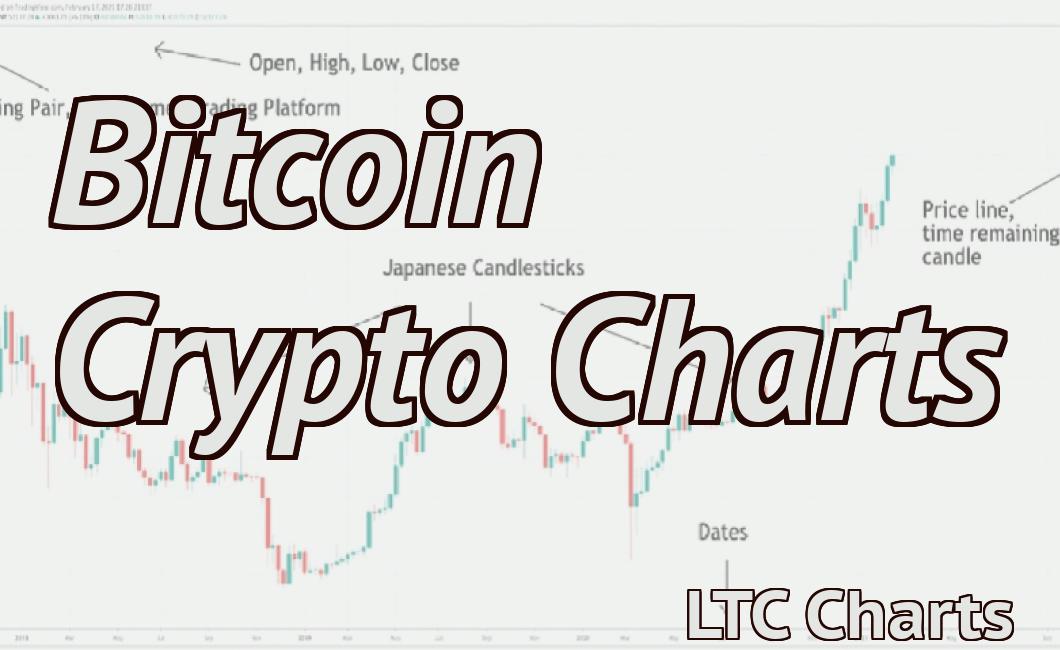
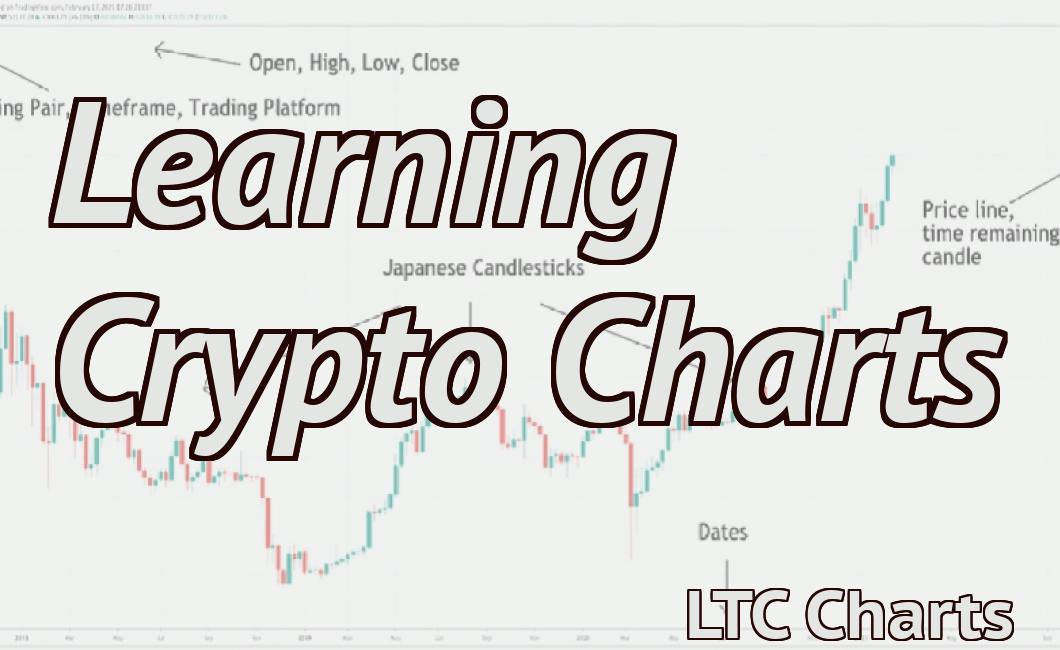
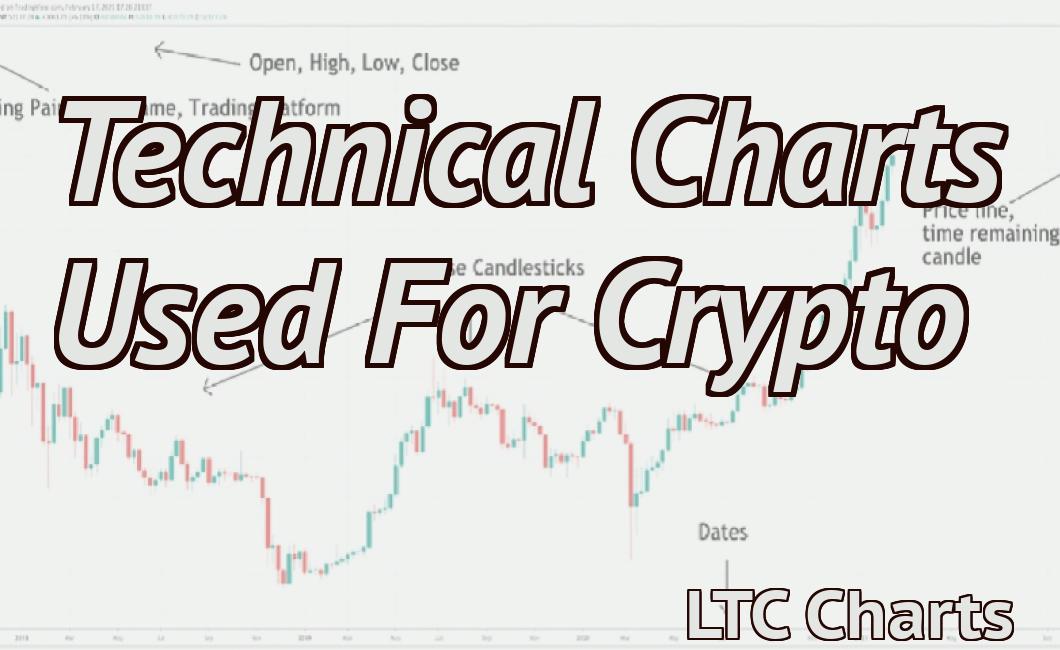
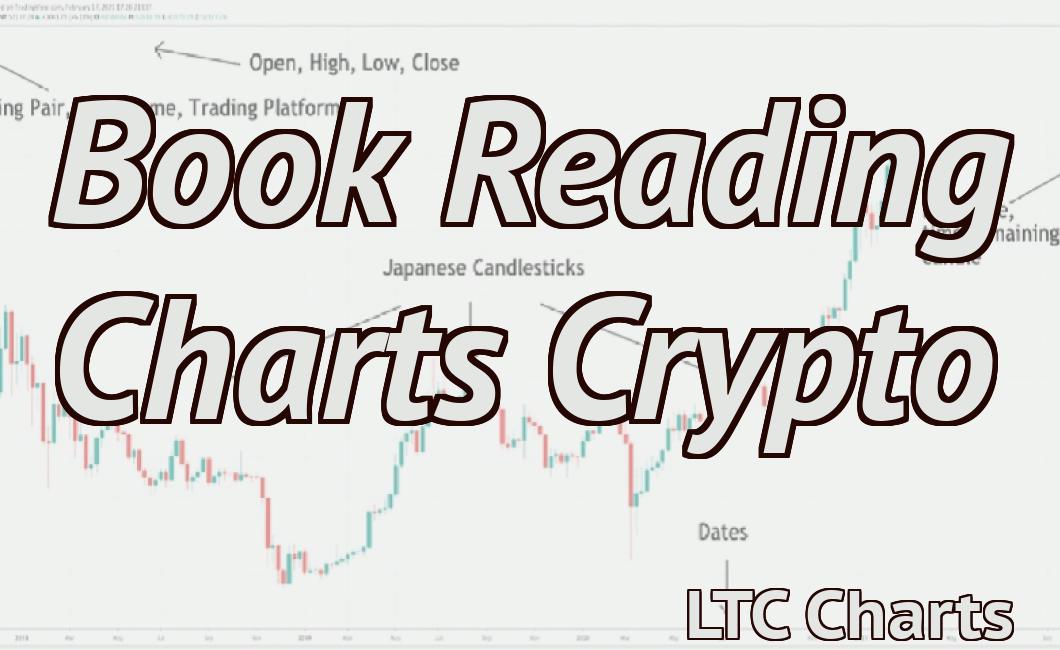
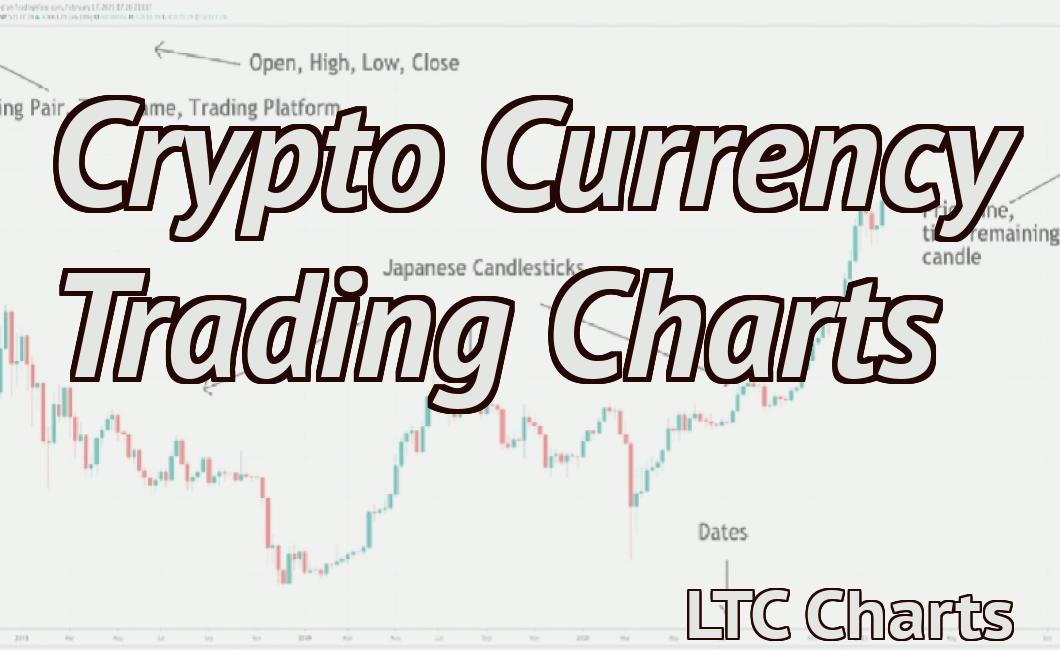
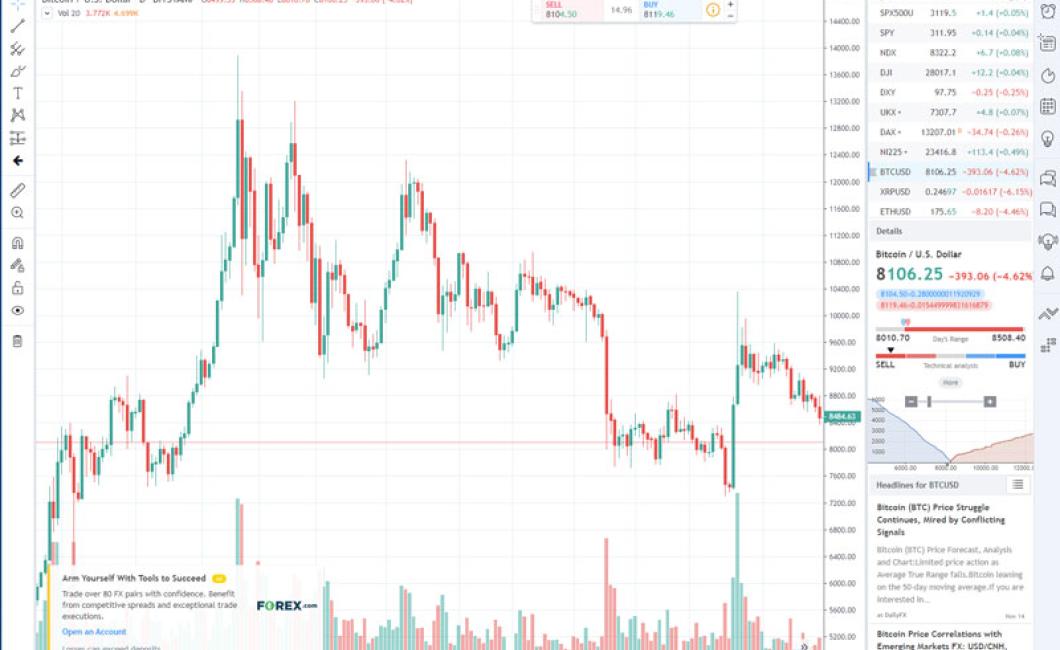
Cryptocurrency candlestick charts are the most common type of cryptocurrency chart, and they show the price of a cryptocurrency over time using open and close prices.
This type of chart is useful for tracking the price of a cryptocurrency over time, as it shows you how the price has fluctuated over the course of a given period.
However, candlestick charts can be difficult to use, as they require you to understand how to read candlestick patterns.
Another type of cryptocurrency chart is a bar chart.
Bar charts are similar to candlestick charts, but they show the price of a cryptocurrency over a longer period of time.
This type of chart is useful for tracking the price of a cryptocurrency over a longer period of time, as it allows you to see how the price has fluctuated over a longer period.
However, bar charts can be more difficult to use than candlestick charts, as they require you to understand how to read bar charts.
Finally, a pie chart is another type of cryptocurrency chart that can be used to track the price of a cryptocurrency over time.
Pie charts show the percentage of a given cryptocurrency that is owned by different groups or countries.
This type of chart is useful for tracking the distribution of a cryptocurrency over time, as it gives you an idea of who owns what proportion of a given cryptocurrency.
However, pie charts can be difficult to use, as they require you to understand how to read pie charts.
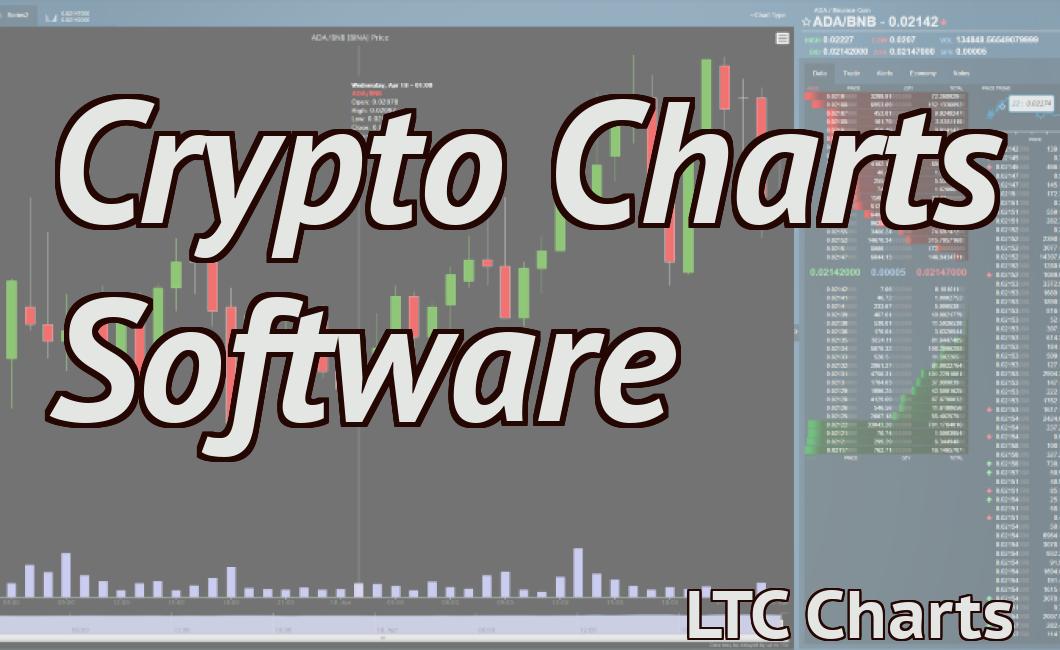
How to Create Your Own Custom Crypto Charts
There are several ways to create your own custom crypto charts.
One way is to use a cryptocurrency prices tracking tool, like CoinMarketCap.com. Enter the cryptocurrency you want to track, and the tool will generate a chart showing its performance over time.
Another way to create your own charts is to use a cryptocurrency trading platform. These platforms allow you to enter the amount of cryptocurrency you want to trade, and the platform will generate a chart of your chosen cryptocurrency's performance over time.
Finally, you can also use a cryptocurrency price analysis tool, like CoinMarketCap.com, to generate custom crypto charts based on the data it collects.
Guidelines for Viewing Crypto Charts
There are a few things to keep in mind when viewing cryptocurrency charts:
1. Always consult a financial advisor before investing in any digital currency or asset.
2. Always be aware of the risk associated with any investment, and do your own research before making a decision.
3. Always be aware of the latest news and events related to cryptocurrencies and other digital assets.
Top Tips for Viewing Crypto Charts
There are a few tips that can help while viewing crypto charts.
1. Look at the overall trend of the market – is it going up, down, or sideways? This will give you an idea of where the market is headed.
2. Check out the 24-hour charts to see how the market is reacting to recent events. This can help you determine whether a market dip is due to news or just a dip in the market itself.
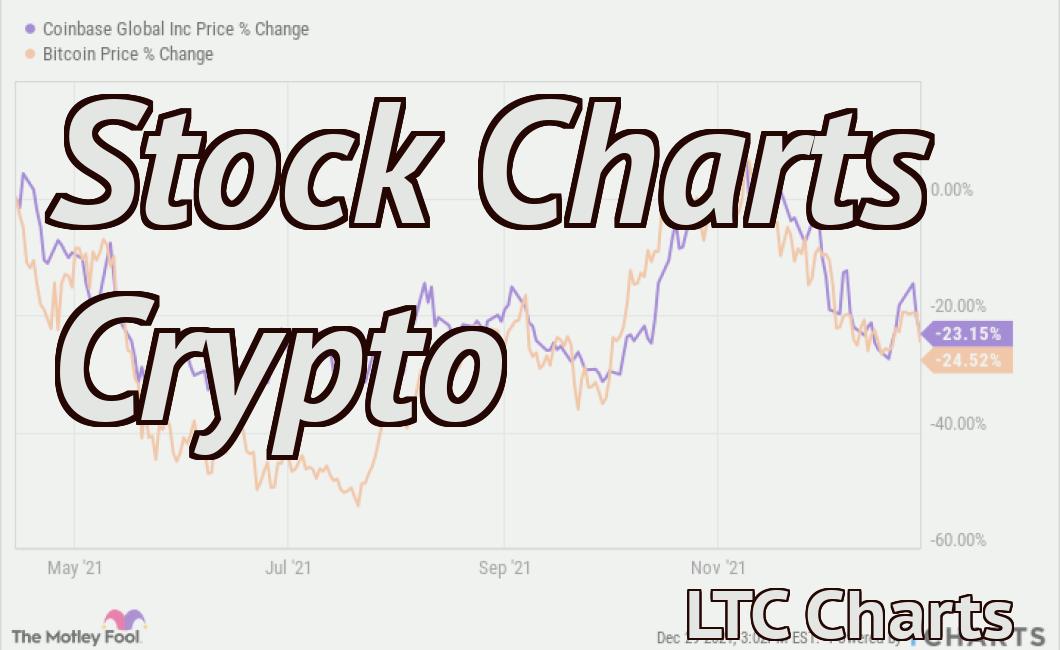
3. Compare different coins and see which ones are doing well. This can help you decide which coins to invest in.
4. Compare prices across multiple exchanges to get an idea of the market’s volatility. This can help you decide whether you want to invest in a specific coin or not.
FAQs About Viewing Crypto Charts
1. What is a crypto chart?
Crypto charts are a visual representation of the price of cryptocurrencies, tokens and other digital assets. They are used to track the performance of specific cryptocurrencies or digital assets.
2. What do crypto charts show?
Crypto charts show the price of cryptocurrencies, tokens and other digital assets over time. They can also show the volume of trading activity for a specific cryptocurrency or digital asset.
3. Is a crypto chart a good way to invest in cryptocurrencies?
There is no definite answer to this question. Some people believe that crypto charts can be helpful in deciding whether or not to invest in cryptocurrencies. Others believe that crypto charts are not a good way to invest in cryptocurrencies. It is important to do your own research before investing in cryptocurrencies.